

Geopolitics: China continues to struggle in efforts to revive its economy while simultaneously dealing with an overleveraged real estate sector in “work out” mode. The country’s malinvestment in real estate has been recognized for years, but developer loans are now coming due with several on the brink of default. For now, policy makers have decided to tread lightly in providing tangible relief measures. Instead, they are offering verbal reassurances while simultaneously appearing determined to hold real estate speculators accountable for their excessive actions.
The situation isn’t wholly dismal. In a recent presentation to investors, iron ore giant Vale Corporation emphasized the favorable long-term outlook for construction demand in China. The demand is driven by the need for greater social housing investments. With 150 million people migrating to urban areas over the next few decades, the bricks and mortar investment required to house these people will be substantial despite a challenging near-term outlook.
The People’s Bank of China (“PBOC”) recently cut key interest rates and encouraged financial institutions to provide greater support to businesses. The goal is to reignite overall growth and improve consumer confidence. It is walking a fine line, though, as lowering interest rates will have the corresponding effect of putting pressure on the nation’s currency, further intensifying domestic deflationary pressures.
This comes at a time when Chairman Xi Jinping is attempting to reduce the country’s reliance on investment as the principal driver of economic growth (an astonishing 42-44% of Gross Domestic Product (“GDP”)) in favor of current consumption. Such an effort to right structural imbalances in the nation’s economy will take time and require a significant shift in consumer savings preferences. This will be a challenge at a time when the population is aging significantly. Furthermore, geopolitical tensions with the West and its more confrontational economic policies are making this transition more difficult.
China does have its own cards to play, of course. Among them is its status as the second largest foreign owner of U.S. Treasuries. As of June 2023, China’s $835 Billion in Treasury obligations put it behind only Japan, which owns $1,106 Billion (see graph below). While China’s holdings have shrunk considerably since the U.S. policy turn in 2017, the sheer size forces both countries to seek accommodation with each other. Particularly given the immense funding needs of the U.S. government in the years ahead, each country will want to reach a modus vivendi – for the Chinese, this means, among other things, a less adversarial U.S. position on trade and joint cooperation managing foreign exchange volatility, in return for China’s ongoing participation in U.S. debt financings.
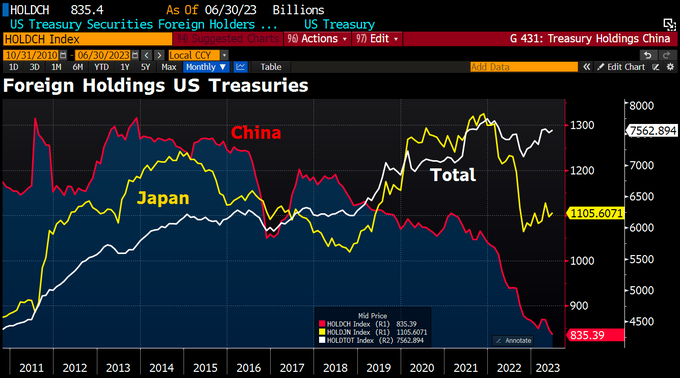
Source: The Market Ear (“TME”) as of 6/30/2023
Stock Market: Equities fell in August, which saw the S&P 5001 down -1.77%, the Nasdaq 1002 -1.62%, the MSCI EAFE Index3 -1.84%, and the Russell 20004 down a more pronounced -5.17%. The final tally fails to capture the magnitude of the indices’ price movements as markets fell heavily for much of the month before rallying sharply in the last week. Rising interest rates were the primary cause of the weakness as healthy economic reports once again pushed back on the recession narrative and a more dovish Federal Reserve.
Retail sales were particularly vigorous, up 0.7% month over month compared to consensus expectations of a 0.4% increase. Industrial production rose 1% from a month earlier in July 2023, the most in six months and substantially above the market forecast for a 0.3% increase. According to the Atlanta Fed’s GDPNow indicator for Q3 2023, real GDP growth continues to rise, increasing from 3.9% at the start of August to 5.6% by month’s end.
These and other stronger than expected economic reports boosted interest rates. Not until Federal Reserve Chairman Powell’s Jackson Hole speech on the 25th did market fortunes reverse. By choosing to use the word “could” instead of “would,” Powell conveyed a less hawkish policy and a pause in rate hikes at the next Federal Open Market Committee (“FOMC”) meeting in September. This bullish news was quickly followed by evidence of cooling in the labor markets, with job openings falling to 8.83 million, far less than consensus expectations of 9.47 million; whereas the drop in employees quitting their jobs was not as dramatic, falling 253,000 month over month, with the absolute number of 3.55 million, the lowest reading in over two-and-a-half years. Amid continuing positive inflation numbers, these signs of labor demand and supply coming back into balance were sufficient to engender a strong rally in equities.
The inflation outlook is more nuanced. The chart below shows Goldman Sachs’ estimate of where core Consumer Price Index (“CPI”) is headed in the latter half of 2023 and calendar 2024. A temporary uptick in month over month core CPI prints is expected through the end of this year before they again begin to fall back in 2024. Overall, this positive backdrop, should it occur, will be supportive of equity prices as it will give the monetary authorities reason to at least pause, although it may be premature to anticipate a cut in rates.
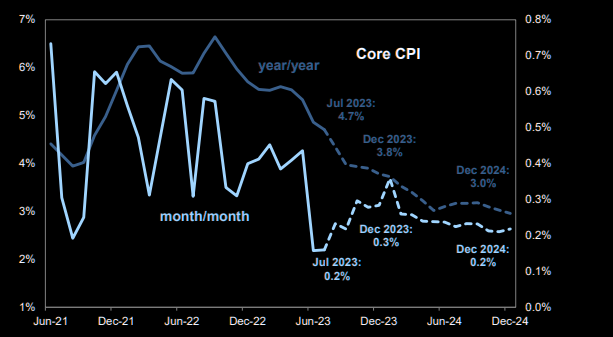
Source: Goldman Sachs as of 7/30/2023
Fixed Income: The bond market in August was mixed once again, with losses mostly confined to longer term maturities in higher quality issues. The benchmark 10-year Treasury fell -0.92%, the 30-year Treasury down a hefty -3.14% and the the Bloomberg Barclays U.S. Aggregate Bond Index5 down -0.64% in the month. By comparison, the 2-year Treasury actually gained 0.35%, the 5-year essentially flat (-0.05%) and the Bloomberg Barclays U.S. Corporate High Yield Index6 up 0.28%.
To the surprise of many, the leveraged loan index as measured by Morningstar’s LSTA US Leveraged Loan Index7 has strongly advanced this year, up 9.11%, far exceeding the performance of government and investment grade bonds. Only the high yield sector (measured by the Bloomberg Barclays U.S. Corporate High Yield Index) has kept pace, up 7.13% YTD through August.
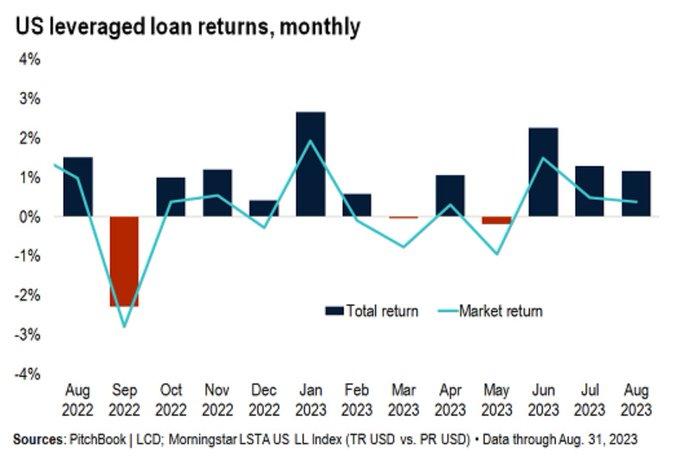
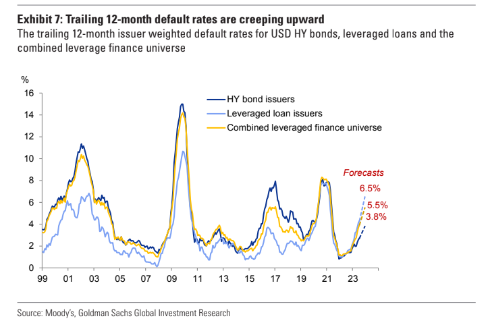
The outperformance is due to a stronger than expected economy, the floating rate nature of most of these loans, a lack of new supply and relatively healthy corporate balance sheets. However, default rates in the leveraged finance universe are creeping up, as can be seen in the chart below, and while spreads have yet to take note, the uptick is worrisome.
As of 8/31/2023
While bonds and stocks don’t always track each other – at least on a short terms basis - rates do act as a magnet on equity valuations in the form of the discount rate applied to company earnings. This “intertwining” between rates and stock valuations can swing widely as evidenced in the chart below. Driven by investor enthusiasm with artificial intelligence, NASDAQ valuation is quite extended relative to where the 10-year Treasury is trading. While such a disconnect can continue for an indeterminate period of time, the anomaly will ultimately get resolved, either through higher corporate growth, lower interest rates, a drop in the multiple investors put on the index or, more likely, some combination thereof.
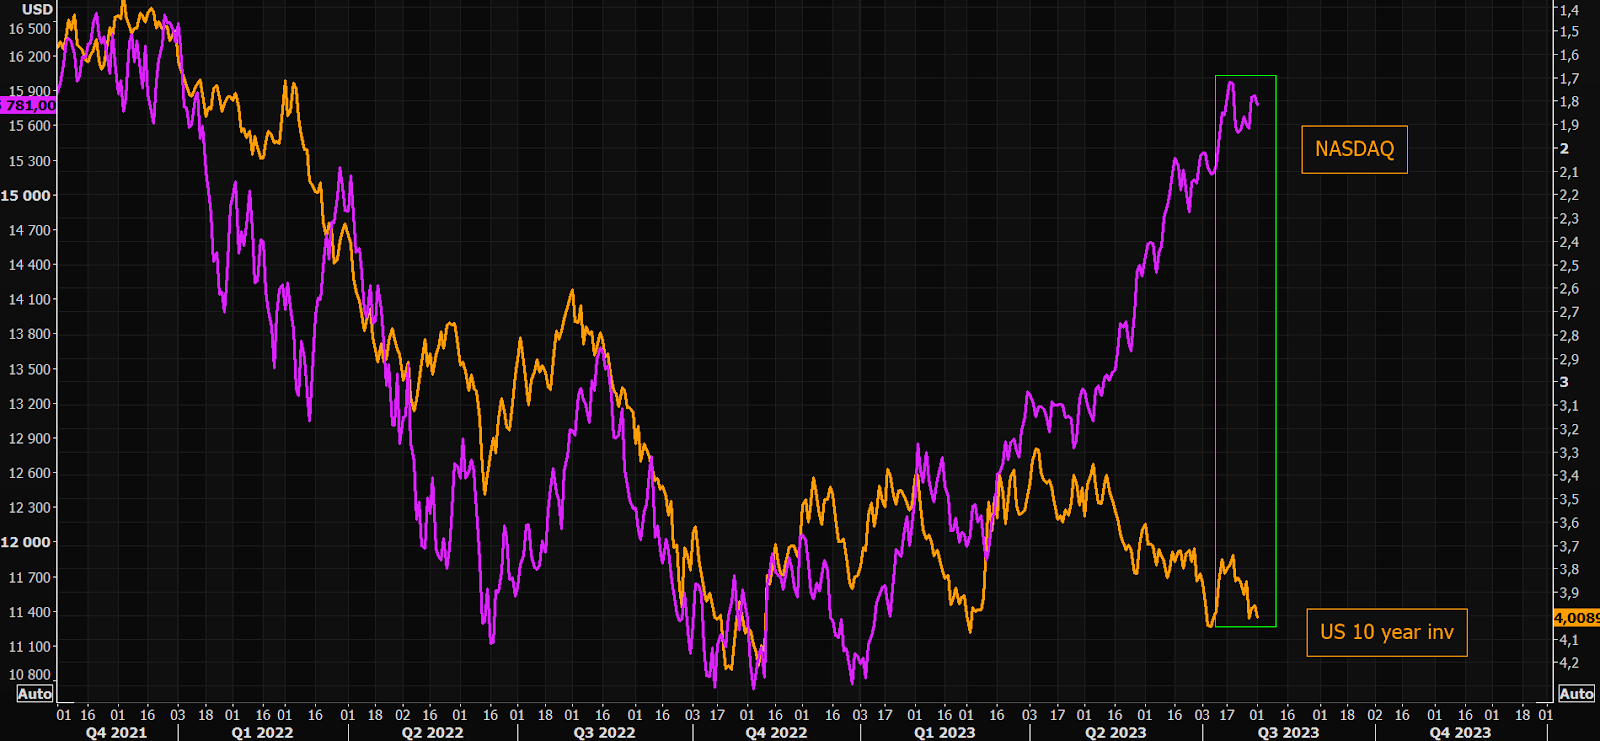
Source: Bloomberg as of 7/31/2023
Federal Reserve and Monetary Policy: The Wall Street Journal’s Nick Timiraos, the paper’s chief economics correspondent recently wrote the Federal Reserve is undergoing an important shift in its thinking on rate increases, asserting the Fed will take a much harder look as to whether rate hikes post the September meeting will be needed. The worry is further hikes will lead to a hard landing and precipitate financial turmoil, which would not be a desirable outcome, especially in an election year.
This change in the Fed’s thinking comes as economic data has turned decidedly mixed with strong arguments to be made in favor of continued growth, as well as an impending turndown. Bill Ackman, a long-time economic bull, pointed out in a recent interview that fiscal stimulus from the Inflation Reduction Act and other infrastructure programs is yet to fully impact the economy, and the psychological impact of the pandemic continues to resonate as evidenced by the lack of consumer spending constraint. Demand for labor, while slowing, remains relatively robust with wages reflective of companies’ desire to retain workers. The Purchasing Managers’ Non-Manufacturing (Services) Index8 continues to show surprising strength while credit markets are showing little stress at the moment.
On the flip side, the mortgage market has slowly but surely ground to a halt with rates at decades highs, the nation’s unemployment rate is creeping up, credit card delinquencies have exploded higher for lower income borrowers, oil prices have moved up substantially since bottoming in June, banks have tightened lending standards over the course of the year (with the impact of higher capital rules still to be felt), and monthly Institute of Supply Management (“ISM”) manufacturing readings have been below 50 for many months. The inversion in the Treasury yield curve also argues a slowdown of some magnitude is in the offing. Since 1978, the yield curve has inverted six times (not counting the current inversion period) and has preceded a recession each time.
All of this translates into a cloudy picture of the future direction of the U.S. economy so it shouldn’t come as much surprise the Fed itself is waiting for more definitive data points before deciding its next move. The market still believes the Fed will pause beginning in September before embarking on a series of rate cuts in 2024 as a recession of some magnitude takes hold.
Managed Income Strategy
During the month of August, U.S. High Yield remained stable, with slight positive returns across the sector. As was the case in July, segments of the bond segments most sensitive to changes in interest rates, such as investment grade corporate bonds and U.S. Treasuries, continued to decline as yields pushed higher. The Managed Income portfolio remains in a Risk-On posture, tilted heavily to U.S. High Yield, with a smaller allocation in floating rate fixed income, which outperformed high yield during the month.
We anticipate Managed Income to remain in a “Risk-On” posture as long as current conditions persist, as conditions are still favorable to receive the higher coupon payments the sector offers, with rangebound price movement in the sector as of late. Should conditions deteriorate, it is possible we could see Managed Income reverting back to a “Risk-Off” posture.
Dynamic Growth Strategy
Dynamic Growth moved to a Risk-Off position in early August, after equity markets fell from local highs in mid-July. This ended a Risk-On trade dating back to early June. August and September are historically higher volatility months for the stock market. While Risk-Off periods have been relatively short-lived for Dynamic Growth this year, should the negative trend continue, we could see a longer-duration trade. As of month-end, Dynamic Growth remains positioned in cash equivalents, which continue to deliver meaningful yield due to the current interest rate regime.
Active Advantage Strategy
In early August, Active Advantage made a slight change to its balanced position, reducing its exposure to growth equities. The Active Advantage strategy spent the month of August in a balanced portfolio, with approximately 50% in equities, 40% in fixed income, and 10% cash equivalents. As noted above, we are paying close attention to seasonal volatility patterns, which could result in decreased exposure for the strategy. However, as of now, general trends in U.S. High Yield—Active Advantage’s largest fixed income allocation—remain stable. We anticipate remaining in the current balanced position if trends across core equities and fixed income retain stability.
Defender Strategy
The Defender Strategy experienced some decreased momentum across several tracked asset classes entering the month of September, reducing overall risk exposure to 70%, from 90% the month prior. There were also some shifts in exposure entering September with the Strategy selling out of U.S. Small Cap Equities and Emerging Markets and replacing those two spots with Gold and Commodities. As U.S. Equities and International Equities continue to see some headwinds, this reallocation is more defensive toward those traditionally more volatile asset classes while at the same time taking advantage of positive trends across commodities. For a continued diversified income generation, the Strategy’s Option Overlay positions remain in place.
1The S&P 500 is a stock market index, inclusive of approximately 500 of the largest U.S. companies, that is widely regarded as a measure of how well the stock market is performing overall.
2The Nasdaq 100 is an index that tracks the performance of more than 100 of the largest and most actively traded non-financial companies listed on the Nasdaq stock exchange, which is the second largest in the world.
3The MSCI EAFE Index is a stock market index that measures the equity market performance of developed markets outside the U.S. and Canada.
4The Russell 2000 Index is a small-cap U.S. Stock market index that measures the performance of the smallest 2,000 companies included in the Russell 3000 Index.
5The Bloomberg Barclays U.S. Aggregate Bond Index, also know as the Agg, is a widely recognized market capitalization-weighted index that tracks the performance of the U.S. investment-grade bond market.
6The Bloomberg Barclays U.S. Corporate High Yield Index is a financial metric that measures the USD-denominated, high yield, fixed-rate corporate bond market.
7The Morningstar LSTA US Leveraged Loan Index is a financial index designed to measure the performance of the 100 largest facilities in the US leveraged loan market.
8The Purchasing Managers’ Non-Manufacturing (Services) Index is an economic indicator that measures the health of the non-manufacturing sectors, such as the service industry.
Click below to subscribe to our Insights!
Receive email notifications when new articles are published

Investing involves risk. Principal loss is possible.
Risks specific to the Managed Income Strategy include Management Risk, High-Yield Risk, Fixed-Income Security Risk, Foreign Investment Risk, Loans Risk, Market Risk, Underlying Funds Risk, Non-Diversification Risk, Turnover Risk, U.S. Government Securities Risk, Interest Rate Risk, Models and Data Risk.
Risks specific to the Dynamic Growth Strategy include Management Risk, Equity Securities Risk, Market Risk, Underlying Funds Risk, Non-Diversification Risk, Small and Mid-Capitalization Companies Risk, Turnover Risk, U.S. Government Securities Risk, Models and Data Risk.
Risks specific to the Active Advantage Strategy include Management Risk, Equity Securities Risk, High-Yield Risk, Fixed- Income Security Risk, Foreign Investment Risk, Loans Risk, Market Risk, Underlying Funds Risk, Limited History of Operations Risk, Non-Diversification Risk, Small and Mid-Capitalization Companies Risk, Turnover Risk, U.S. Government Securities Risk, Interest Rate Risk, Models and Data Risk.
Risks specific to the Defender Strategy include general market risk, credit risk, interest rate risk, management risk, equity securities risk, fixed-income securities risk, high-yield bond risk, foreign investment risk, emerging markets risk, real estate and REITs risk, commodities risk, currency risk, subsidiary risk, market risk, underlying funds risk, derivatives risk, limited history of operations risk, turnover risk, models and data risk, momentum risk or risk of the portfolio not performing as expected.
There is no guarantee that the investment objectives will be achieved. Moreover, the past performance is not a guarantee or indicator of future results. The investment return and principal value of an investment will fluctuate so that an investor’s shares, when redeemed, may be worth more or less than their original cost.
This is for informational purposes only and should not be construed as a solicitation to buy or sell, or to invest in any investment product or strategy. Investing in securities markets involves risk and the degree of risk varies by the type of investment or strategy. For a complete list of the risks associated with each of our Strategies, please review the Strategy Brochure and Factsheet. Materials such as blog posts, newsletters or commentary may contain information deemed to be correct and appropriate at a given time but may not reflect our current views or opinions due to changing market conditions. No information provided should be viewed as, or used as a substitute for individualized investment advice.
This document does not constitute advice or a recommendation or offer to sell or a solicitation to deal in any security or financial product. It is provided for information purposes only and on the understanding that the recipient has sufficient knowledge and experience to be able to understand and make their own evaluation of the proposals and services described herein, any risks associated therewith and any related legal, tax, accounting or other material considerations. To the extent that the reader has any questions regarding the applicability of any specific issue discussed above to their specific portfolio or situation, prospective investors are encouraged to contact the professional advisor of their choosing.
Certain information contained herein has been obtained from third party sources and such information has not been independently verified by Kensington Asset Management, LLC (“KAM”). No representation, warranty, or undertaking, expressed or implied, is given to the accuracy or completeness of such information by KAM or any other person. While such sources are believed to be reliable, KAM does not assume any responsibility for the accuracy or completeness of such information. KAM does not undertake any obligation to update the information contained herein as of any future date.
Any indices and other financial benchmarks shown are provided for illustrative purposes only, are unmanaged, reflect reinvestment of income and dividends and do not reflect the impact of advisory fees. Investors cannot invest directly in an index. Comparisons to indexes have limitations because indexes have volatility and other material characteristics that may differ from a particular strategy. For example, a strategy may typically hold substantially fewer securities than are contained in an index.
Certain information contained herein constitutes “forward-looking statements,” which can be identified by the use of forward-looking terminology such as “may,” “will,” “should,” “expect,” “anticipate,” “project,” “estimate,” “intend,” “continue,” or “believe,” or the negatives thereof or other variations thereon or comparable terminology. Due to various risks and uncertainties, actual events, results or actual performance may differ materially from those reflected or contemplated in such forward-looking statements. Nothing contained herein may be relied upon as a guarantee, promise, assurance or a representation as to the future.
Definitions:
Equity Securities Risk: The Fund may invest in or have exposure to equity securities. Equity securities may experience sudden, unpredictable drops in value or long periods of decline in value. This may occur because of factors that affect securities markets generally or factors affecting specific industries, sectors, geographic markets, or companies in which the Fund invests.
Fixed-Income Security Risk: The Fund may invest in or have exposure to fixed-income securities. Fixed-income securities are or may be subject to interest rate, credit, liquidity, prepayment and extension risks. Interest rates may go up resulting in a decrease in the value of fixed-income securities. Credit risk is the risk that an issuer will not make timely payments of principal and interest. There is also the risk that an issuer may “call,” or repay, its high yielding bonds before their maturity dates. Fixed-income securities subject to prepayment can offer less potential for gains during a declining interest rate environment and similar or greater potential for loss in a rising interest rate environment. Limited trading opportunities for certain fixed-income securities may make it more difficult to sell or buy a security at a favorable price or time. Changes in market conditions and government policies may lead to periods of heightened volatility and reduced liquidity in the fixed income securities market, and could result in an increase in redemptions. Interest rate changes and their impact on a fund and its share price can be sudden and unpredictable.
Foreign Investment Risk: Foreign investments may be riskier than U.S. investments for many reasons, such as changes in currency exchange rates and unstable political, social, and economic conditions.
High-Yield Risk: Lower-quality fixed income securities, known as “high-yield” or “junk” bonds, present greater risk than bonds of higher quality, including an increased risk of default. These securities are considered speculative. Defaulted securities or those subject to a reorganization proceeding may become worthless and are illiquid.
LIBOR Risk: Changes related to the use of the London Interbank Offered Rate (LIBOR) or similar interbank offered rates (“IBORs,” such as the Euro Overnight Index Average (EONIA)) could have adverse impacts on financial instruments that reference LIBOR or a similar rate. While some instruments may contemplate a scenario where LIBOR or a similar rate is no longer available by providing for an alternative rate setting methodology, not all instruments have such fallback provisions and the effectiveness of replacement rates is uncertain. The abandonment of LIBOR and similar rates could affect the value and liquidity of instruments that reference such rates, especially those that do not have fallback provisions. The use of alternative reference rate products may impact investment strategy performance.
Limited History of Operations Risk: The Fund has a limited history of operations for investors to evaluate. The Fund may fail to attract sufficient assets to operate efficiently.
Loans Risk: The market for loans, including bank loans, loan participations, and syndicated loan assignments may not be highly liquid, and the holder may have difficulty selling them. These investments expose the Fund to the credit risk of both the financial institution and the underlying borrower. Bank loans settle on a delayed basis, which can be greater than seven days, potentially leading to the sale proceeds of such loans not being available for a substantial period of time after the sale of the bank loans.
Management Risk: The Adviser’s reliance on its proprietary trend-following model and the Adviser’s judgments about the attractiveness, value, and potential appreciation of particular assets may prove to be incorrect and may not produce the desired results.
Market Risk: Overall investment market risks affect the value of the Fund. Factors such as economic growth and market conditions, interest rate levels, and political events affect U.S. and international investment markets. Additionally, unexpected local, regional or global events, such as war; acts of terrorism; financial, political or social disruptions; natural, environmental or man-made disasters; the spread of infectious illnesses or other public health issues (such as the global pandemic coronavirus disease 2020 (COVID-19)); and recessions and depressions could have a significant impact on the Fund and its investments and may impair market liquidity. Such events can cause investor fear, which can adversely affect the economies of nations, regions and the market in general, in ways that cannot necessarily be foreseen.
Models and Data Risk: The Fund’s investment exposure is heavily dependent on proprietary quantitative models as well as information and data supplied by third parties (“Models and Data”). When Models and Data prove to be incorrect or incomplete, any decisions made in reliance thereon may lead to securities being included in or excluded from the Fund’s portfolio that would have been excluded or included had the Models and Data been correct and complete. Some of the models used by the Fund are predictive in nature. The use of predictive models has inherent risks. For example, such models may incorrectly forecast future behavior, leading to potential losses. In addition, in unforeseen or certain low-probability scenarios (often involving a market disruption of some kind), such models may produce unexpected results, which can result in losses for the Fund.
Non-Diversification Risk: As a non-diversified fund, the Fund may invest more than 5% of its total assets in the securities of one or more issuers. The Fund also invests in underlying funds that are non-diversified. The Fund’s performance may be more sensitive to any single economic, business, political or regulatory occurrence than the value of shares of a diversified investment company.
Small and Mid-Capitalization Companies Risk: Investing in or having exposure to the securities of small-capitalization and mid-capitalization companies involves greater risks and the possibility of greater price volatility than investing in larger capitalization and more-established companies. Investments in mid-cap companies involve less risk than investing in smallcap companies. Smaller companies may have limited operating history, product lines, and financial resources, and the securities of these companies may lack sufficient market liquidity. Mid-cap companies often have narrower markets and more limited managerial and financial resources than larger, more established companies.
Turnover Risk: A higher portfolio turnover may result in higher transactional and brokerage costs. The Fund’s portfolio turnover rate may be significantly above 100% annually
Underlying Funds Risk: Investments in underlying funds involve duplication of investment advisory fees and certain other expenses. Each underlying fund is subject to specific risks, depending on the nature of its investment strategy. The manager of an underlying fund may not be successful in implementing its strategy. ETF shares may trade at a market price that may be lower (a discount) or higher (a premium) than the ETF’s net asset value. ETFs are also subject to brokerage and/or other trading costs, which could result in greater expenses to the Fund. Because the value of ETF shares depends on the demand in the market, the Adviser may not be able to liquidate the Fund’s holdings at the most optimal time, adversely affecting performance.
U.S. Government Securities Risk: The Fund may invest directly or indirectly in obligations issued by agencies and instrumentalities of the U.S. government. The U.S. government may choose not to provide financial support to U.S. government sponsored agencies or instrumentalities if it is not legally obligated to do so, in which case, if the issuer defaulted, the Fund might not be able to recover its investment.
Advisory services offered through Kensington Asset Management, LLC.