The Halloween Effect
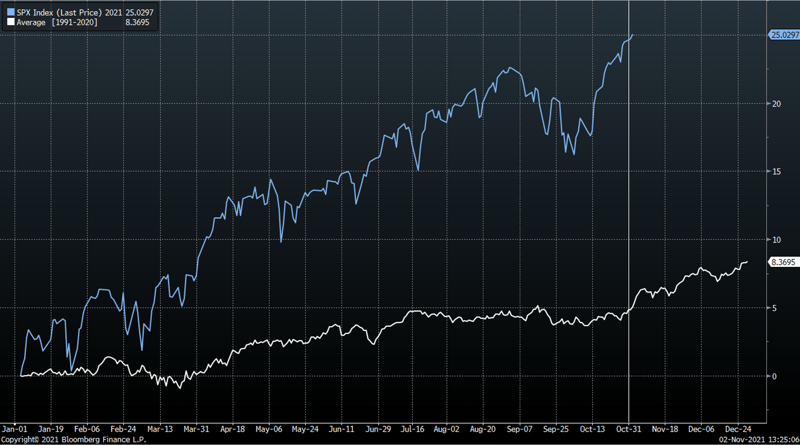
In our previous commentary, we discussed the well known seasonal adage known as “Sell in May and Go Away.” The corollary to that is the “Halloween Effect,” which is the seasonal tendency for stronger equity returns during the months of November through April (illustrated in Figure 1). True to form, the month of November has started strong for equities. It’s interesting to note that November marks the start of the wind down of stock buyback blackouts, so companies can begin to announce share buybacks, which can prove to be a tailwind and provide support to this strong seasonal tendency. Of course, there is still the looming threat of the debt ceiling deadline which has been delayed until December, though the market has tended to navigate this challenge rather well in the past.

Figure 1. Average S&P 500 Performance over the last 30 years ending in 2020. Source: Bloomberg Finance L.P.
Investors Focus on Higher Quality High Yield
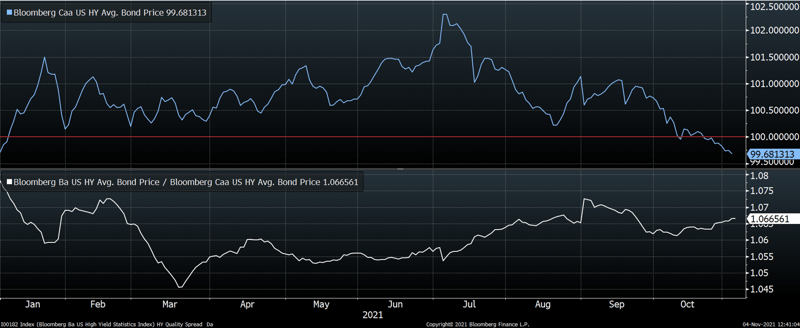
While lower quality high yield bonds offer higher coupon payments than their BB counterparts, investors must take into account the possibility of elevated default risk. Even with the low current and projected default rate for high yield bonds, the reality is that CCC issues are more likely to suffer downgrades versus BB issues. As can be seen in the upper chart in Figure 2 below, CCC credit on average traded above par for the first half of this year, reaching a peak in early July. Since then, the premium has ratcheted down to the point where these bonds are now priced at a discount to par. Conversely, the prices of BB bonds (displayed in the lower chart of Figure 2) have maintained their premium, reflecting an investor preference for higher quality issues. This observation has guided the composition of Kensington’s Managed Income portfolio.

Figure 2. The par weighted average bond price for Ba credit against Caa credit. Source: Bloomberg Finance L.P.
A Flattening Curve, So Far
When speaking about rising or falling rates, it’s important to recognize that not all parts of the yield curve move in tandem. For example, a sharp rise in the short end of the curve doesn’t necessarily have to be followed by rising long rates. This was the case from the start of tapering in 2013 until months before the presidential election in 2016, which saw the yield curve flatten as the 2-year rose while the longer end fell. We again saw the yield curve flatten from the start of this October through the FOMC meeting, as 2-year yields rose to levels not seen since March of 2020. However, market participants are concerned that the combination of stronger economic growth in the face of severe supply disruptions is causing inflationary pressures to build. Even though economic growth is slowing relative to its rapid pace earlier this year, there is an expectation that the Fed will be forced to initiate rate hikes in 2022.
Kensington Asset Management
Despite the aforementioned headwinds, Kensington Asset Management’s strategies have maintained a risk-on posture during 2021, with a couple of brief interruptions. Our clients can count on strict adherence to a systematic investment methodology, designed to limit downside exposure while attempting to position portfolios to benefit from positive market trends. We at Kensington Asset Management will always prioritize the protection of our clients principal and believe that strong risk management is more critical than ever, especially in an environment with inflated risk asset valuations and the tendency for markets to exhibit faster, more violent drawdowns.
Best regards,
Kensington Asset Management Team

