

Geopolitics: The relative calm of January quickly ended in early February when a Chinese surveillance balloon, later confirmed as spycraft, was shot down by U.S. fighter jets off the coast of South Carolina. On top of this were warnings over providing material support to Russia in its war on the Ukraine and other numerous public exchanges, the most notable of which was President Xi’s assertion that “Western countries, led by the United States, have implemented all-round containment and suppression of China.”
China’s economy, meanwhile, continued to recover from its Covid-induced slumber, with authorities proclaiming the country would see growth of 5% in the current year. The market took this as welcome news, providing balance to a global economy largely in slowdown mode due to global central bank tightening.
Stock Market: Indices weakened in February with the S&P 500[1] down -2.61%, the Nasdaq 100 falling -0.49% and the small-cap Russell 2000 losing -1.81%. Good economic news was bad news for equities as surprisingly strong nonfarm payrolls print at the beginning of the month and ongoing strength in the services sector of the economy forced a reassessment on the likelihood of a near term pivot by the Federal Reserve Board. Prices of core personal consumption expenditures (excluding food and energy) rose a higher than expected 4.7% year over year, with the month over month increase up strongly (0.6%) versus a forecasted 0.3%. Interest rates jumped over the course of the month as a result, posing a severe headwind for stocks.
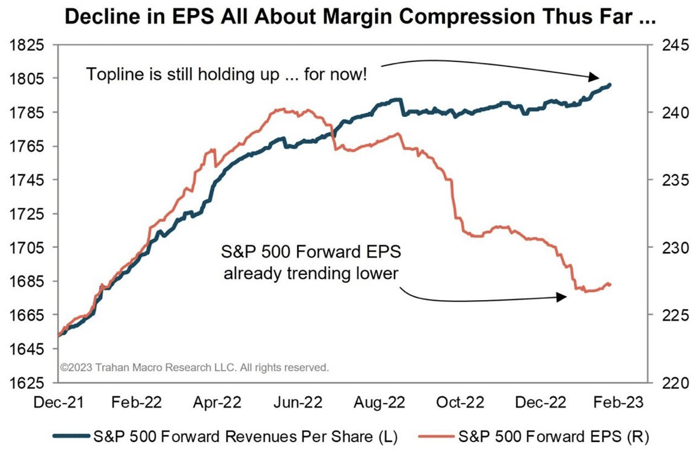
The market’s valuation remains elevated historically, with stocks trading at ~18x earnings vs a long-term average of 16.5x. Although this isn’t egregious by any means, the risk is two-fold: first, if rates continue to track higher, multiples are apt to shrink as the discount rate applied to earnings increases, and secondly, earnings themselves are likely to slow as the economy struggles with higher rates, putting into jeopardy the earnings part of the price-earnings equation.
So far earnings expectations have held up due to a robust top line. Should they begin to slow, earnings may fall short of analyst expectations, especially given the margin compression that’s already taken place (see chart below).
Looking forward and building on seasonality studies, we can see the market historically has performed better in the first half of the third year of the election cycle compared to the second. But more interestingly, in bear markets, outperformance only results in flattish results, whereas in bull markets, the returns are decidedly positive.
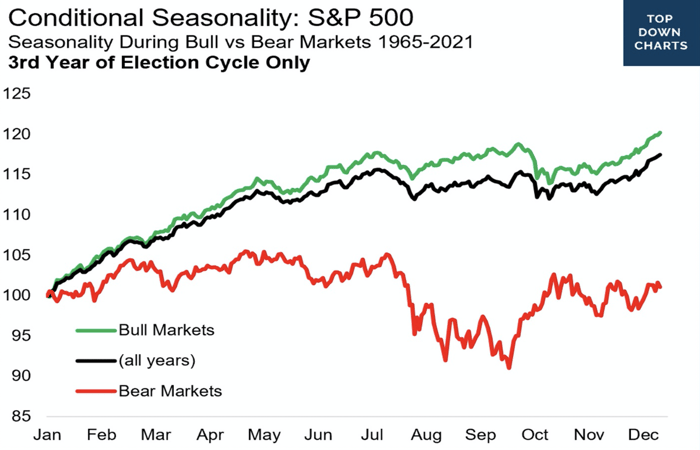
Source: Topdown Charts, Refinitiv Datastream
Notes: In this analysis, "Bull Markets" are defined as years where the market finished up on the year. "Bear Markets" are defined as years where the market ended down on the year. The chart tracks daily average % change during the different market regimes and is a summary of what happened in the past.
Bond Market: As alluded to above, the bond market struggled in February with the U.S. Aggregate Bond Index down -2.59%, the MBS Index falling -2.64 and the 30-Year Treasury bond down a whopping -4.53%. The entire yield curve shifted upwards over the course of the month as investors recalibrated their expectations of the timing of a peak in rates. Of particular note was the reversal in the 2-year Treasury yield, which rose 80 basis points in February to end the month at 4.9%, a new high for the cycle.
By comparison, the corporate high yield market[2] did relatively well, declining only -1.29% in February. Spreads to Treasuries remained historically low, a surprising turn of events given where we are in the tightening cycle and the rapidity of the increases. Much of the reason for high yield’s relative outperformance overall is likely due to many issuers having refinanced at lower rates. Once those bonds mature, the higher interest expense will prove stressful for many. We are already seeing financial strains in the economy, with the number of bankruptcy filings having increased notably (see chart below).
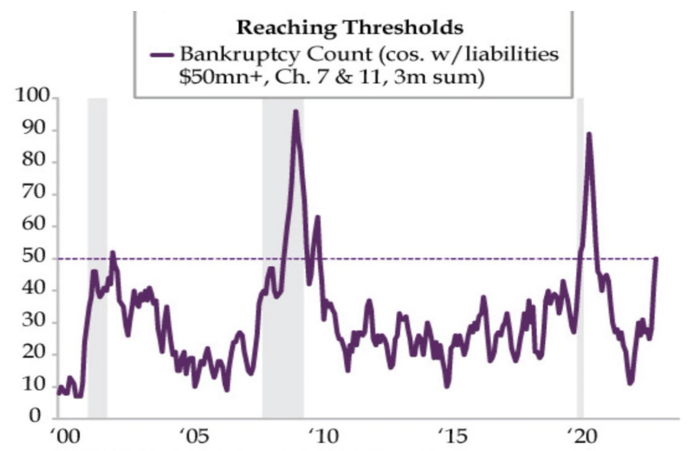
Source: Bloomberg. Recessions shaded. Feb '23 is preliminary.
While the high yield market may not be evidencing stress (yet), the same can’t be said for the bond market overall. The MOVE index, which measures volatility in bond prices, rose dramatically in February, nearing the peaks of October 2022. Perhaps more telling is the elevated levels this index has exhibited since the Fed began tightening. We are beginning to approach levels last seen during the Great Financial Crisis of 2007-9.
Readers shouldn’t assume this is indicating another financial crisis is lurking. Nonetheless, it is telling us there is stress building in the system even as the VIX, the stock market’s own measure of volatility, remains dormant. As the MOVE index’s creator, Harvey Bassman, put it “the bond bucket is actually much bigger, and it tends to signal things ahead of the equity market, because the underlying plumbing of finance happens in the bond market.”
Federal Reserve and Monetary Policy: The Fed exited February convinced there was more work to be done in taming inflation based on hot incoming economic data. Now, though, something has finally “broken” in the financial system (the bankruptcy of a major financial institution) due directly to the Fed’s own tightening policies. The end result is it finds itself in a quandary, pinned in by those same policies and an inflation rate that’s proving difficult to tame.
Because the Fed waited too long in tightening monetary policy following the COVID pandemic, investors are bearing the brunt of a series of rapid interest rate increases brought on by higher than expected inflation. Bond portfolios whose duration was extended during an era of low interest rates are suffering major losses in turn, which in some cases is jeopardizing the viability of financial institutions. This happened in a similar manner in September of last year in the UK when its private retirement system was at risk of blowing up when government rates shot higher.
While ironically, the Fed’s own securities portfolio is facing the same degree of loss, because of its position in the financial system, it can hold such securities until maturity. For private actors such as banks, this is not an option and creates real risk of bankruptcy. Once it becomes clear a bank’s capital position is significantly impaired, it is a very short step before uninsured depositors become anxious and begin to move their money elsewhere. As deposits shrink, the bank is forced to sell assets to maintain required leverage ratios, leading to losses that give depositors even more incentive to take out their money. As was seen with Silicon Valley Bank, the unraveling process can be stunningly swift. And once trust is lost in one banking institution, depositors and investors may soon turn on others resulting in a full-blown bank run.
The quandary for the Fed referred to above now takes center stage. Normally, the collapse of a significant bank would call for an injection of liquidity into the system by the Fed, which wants to make sure other banks have the means to meet withdrawals. By so doing, however, it is highly likely to cause interest rates to fall, an outcome diametrically opposed to the Fed’s desire to slow the economy and inflation through the interest rate mechanism. It becomes a matter of choosing one’s poison so to speak.
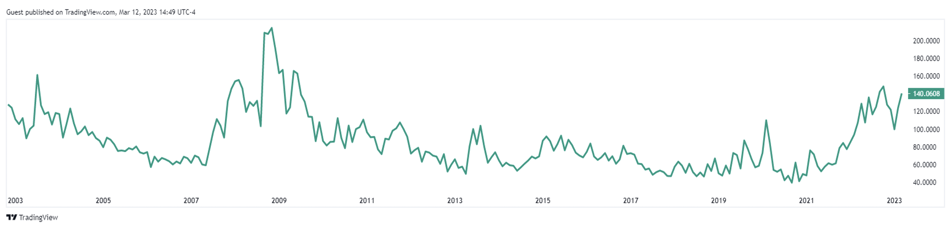
In sum, the Fed is coming to grips with one consequence of its major policy mistake of believing inflation was transitory. Large financial institutions have extended their maturities over many years, were caught off guard by the rapidity of the Fed’s quantitative tightening program, and now are scrambling to bolster their capital reserves in the wake of a historic bond bear market, the worst experienced in decades (see chart below). To add to the series of missteps, only a few of those institutions put hedges in place to guard against rising rates. The Fed will need to watch what happens next very closely, and may be forced to pause, or at least slow, its rate increases in reaction.
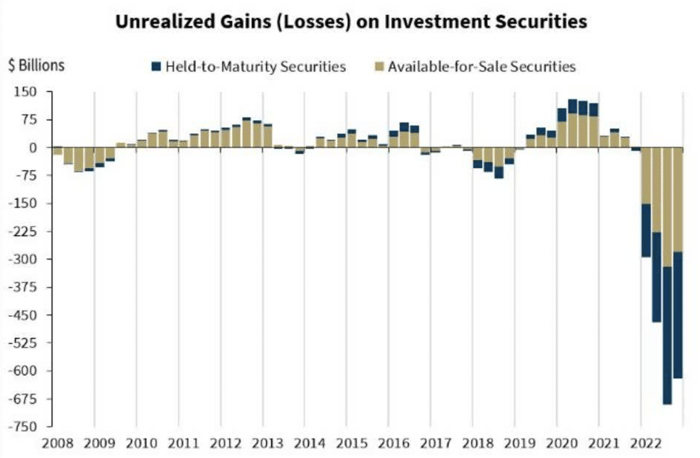
Source: FDIC
Note: Insured Call Report filers only.
Looking forward, it’s now quite likely the Fed will need to slow the pace of its rate increases. The market’s expectation of a 50 basis point hike at the upcoming FOMC meeting will now be lowered to 25 basis points, with future expectations lowered as well. This is not the Fed’s preferred choice, given inflation remains elevated, but it can’t afford to put more banks in jeopardy at this tenuous time.
Managed Income Strategy
Managed Income spent the first half of the month of February in a Risk-On trade, driven by a positive price trend that began in the High Yield fixed income space beginning in late December. This trend began to reverse during the first week of February, and as a result, Managed Income reverted back to a Risk-Off posture mid-month. This trade featured a diversified bond allocation, including Floating Rate and Investment Grade Corporate fixed income securities, which provided diversification. Managed Income is presently positioned in cash and cash equivalents.
Dynamic Growth Strategy
Dynamic Growth spent the month of February alternating between Risk-On and Risk-Off positionings. While Risk-On, Dynamic Growth was weighted more heavily into growth equities, which have broadly outperformed the core and value elements of the equity markets so far this year. Toward the end of the month, we began to observe intraweek volatility increase, which often precedes Risk-Off positioning. We anticipate Dynamic Growth will continue to remain defensively positioned if this higher intraweek volatility persists. As we noted last month, given elevated intraday volatility and relative market uncertainty, we anticipate the Strategy may continue to pivot between Risk-On and Risk-Off more frequently in the coming weeks than historical norms.
Active Advantage Strategy
The Active Advantage Strategy deployed a mixture of allocations throughout February, starting from a diverse allocation featuring cash, fixed income, and equities, and decreasing exposure to a smaller weighting of equities and cash by month end. As with Dynamic Growth, we anticipate allocations within Active Advantage will likely see continued allocation adjustments to both equity and fixed income securities in the coming months as the Strategy risk pivots through choppy markets.
1The S&P 500 Index, or Standard & Poor's 500 Index, is a market-capitalization-weighted index of 500 leading publicly traded companies in the U.S.
2The Bloomberg US Corporate High Yield Bond Index measures the USD-denominated, high yield, fixed-rate corporate bond market.
Investing involves risk. Principal loss is possible.
Risks specific to the Managed Income Strategy include Management Risk, High-Yield Risk, Fixed-Income Security Risk, Foreign Investment Risk, Loans Risk, Market Risk, Underlying Funds Risk, Non-Diversification Risk, Turnover Risk, U.S. Government Securities Risk, LIBOR Risk, Models and Data Risk.
Risks specific to the Dynamic Growth Strategy include Management Risk, Equity Securities Risk, Market Risk, Underlying Funds Risk, Non-Diversification Risk, Small and Mid-Capitalization Companies Risk, Turnover Risk, U.S. Government Securities Risk, Models and Data Risk.
Risks specific to the Active Advantage Strategy include Management Risk, Equity Securities Risk, High-Yield Risk, Fixed-Income Security Risk, Foreign Investment Risk, Loans Risk, Market Risk, Underlying Funds Risk, Limited History of Operations Risk, Non-Diversification Risk, Small and Mid-Capitalization Companies Risk, Turnover Risk, U.S. Government Securities Risk, LIBOR Risk, Models and Data Risk.
Past performance is no guarantee of future results. The investment return and principal value of an investment will fluctuate so that an investor’s shares, when redeemed, may be worth more or less than their original cost.
This is for informational purposes only and should not be construed as a solicitation to buy or sell, or to invest in any investment product or strategy. Investing in securities markets involves risk and the degree of risk varies by the type of investment or strategy. For a complete list of the risks associated with each of our Strategies, please review the Strategy Brochure and Factsheet. Materials such as blog posts, newsletters or commentary may contain information deemed to be correct and appropriate at a given time but may not reflect our current views or opinions due to changing market conditions. No information provided should be viewed as, or used as a substitute for individualized investment advice.
Advisory services offered through Kensington Asset Management, LLC.