

Geopolitics: For years, observers of China’s real estate market have predicted its imminent demise, but like most market predictions, even ones that turn out to be fundamentally correct, its timing has been far off the mark. As far back as 2016, bearish market participants were warning that as much as 15.5% of the nation’s bank loans were in jeopardy of going bad, leading to a debt deflation spiral and currency crisis.
That didn’t happen. This is partially due to the fact China’s economy is state-controlled and politicians there have had every incentive to maintain the status quo, ignoring building excesses. And culturally, owning real estate is the most common way to achieve wealth and status. What also spurred what turned out to be extreme malinvestment was the application of enormous sums of debt financing, often well in advance of the actual construction of the property. This led to a boom in prices which, similar to the West in the mid-2000s, fed upon itself for years even after such investment no longer made economic sense.
Ultimately, the dramatic economic slowdown engendered by the global pandemic, China’s aging population, consumers’ predilection to save, and Chairman Xi’s own directive to slow the country’s investment in real estate, popped the price bubble, leading to bankruptcies and a broader economic slowdown. On top of this is the current effort by Western economies and other nations to reshore their manufacturing production, leading to decreasing export demand for Chinese goods at a time when the country is in dire need of other sources of growth.
Despite these challenges, earnings growth in China has been accelerating since mid-2022 and valuations are nearly as cheap as they were when China dropped its zero-covid policy.
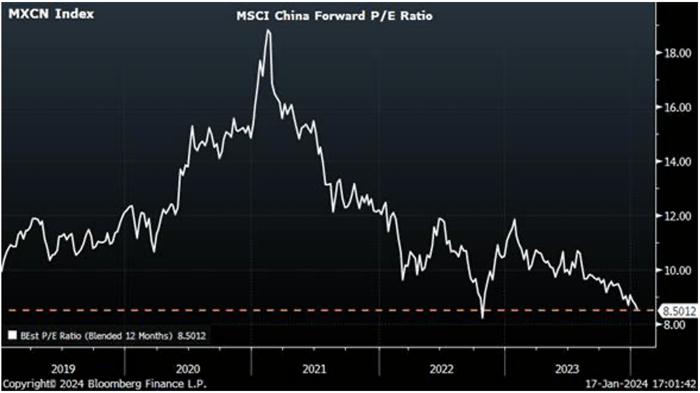
Source: Apollo Global Management, as of Dec 27, 2023
Stock Market: The major domestic indices continued to advance in January in much the same way they have since the cyclical market bottom in October 2022. They have pushed higher, driven by mega-cap technology and communication services companies viewed as primary beneficiaries of recent advances in artificial intelligence. The Nasdaq 100 Index gained 1.85% in the month, while the S&P 500 was up 1.59%. By contrast, the small-cap Russell 2000 fell a surprisingly steep -3.93%, indicative of the continued narrowness of the overall market’s leadership. Almost lost in the mainstream media’s singular focus on U.S. technology firms was the performance of overseas markets, with the Euro Stoxx Index advancing 2.81% and the MSCI EAFE close behind, up 2.61%.
A combination of lower inflation readings along with surprisingly vibrant domestic economic growth provided the backdrop for higher equity prices in the month. According to FactSet, with two-thirds of the S&P 500 companies having reported, 75% of those companies’ earnings have exceeded estimates, while 65% have reported revenues above expectations. Since prices have risen right along with those higher earnings, price-earnings multiples have continued to expand and are now above 20, slightly above the 5-year average.
The current market is momentum-driven, with winners continuing to move higher, while companies facing the slightest adversity experience heavy selling. This is behavior typical of stretched markets and normally resolves itself in one of two ways: either a broadening in market leadership or a correction of some magnitude. History argues any correction will be temporary, given the historical performance of US markets during election years (chart below). There is an interesting caveat, however; since 1960, there were two election years where returns were decidedly negative, those being 2000 and 2008.
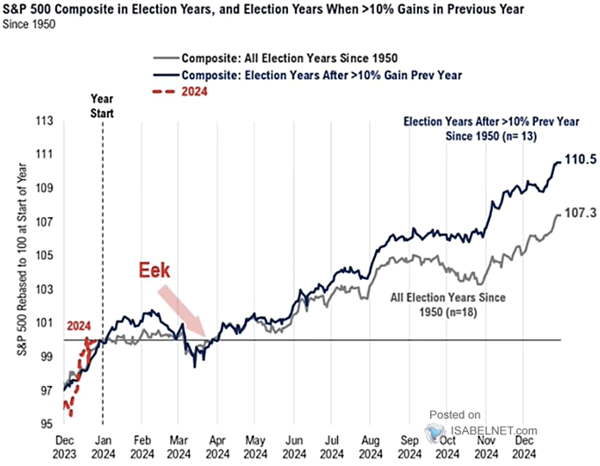
Source: Fundstrat, Bloomberg
Fixed Income: In contrast to equities, fixed income markets were flat to down in January, with the benchmark 10-year Treasury off -0.32%, the longer duration 30-year falling a more severe -2.75% (the curve steepened significantly over the course of the month), mortgage-backed bonds losing -0.46% and lastly, the credit-driven high yield market flat.
The bond market is contending with data that serve up somewhat contradictory perspectives about the state of the economy. On the one hand, many inflation readings continue to trend down and would argue for lower rates. The core Personal Consumption Expenditures Price Index increased by 0.2% month-over-month in January, in line with expectations and representing a 2.9% rise year-over-year. The Institute of Supply Management (ISM) reported manufacturing prices fell in December (although prices reversed and rose substantially in January) while consumer inflation expectations rose by a much less than expected 3%, the lowest level since January 2021.
On the other hand, inflation data isn’t uniformly positive and may have reached a temporary plateau. As mentioned above, ISM Manufacturing Prices were up strongly in January and well above forecasts, as were ISM Services Prices. The very recently reported U.S. Core Inflation Rate jumped to 0.4%, well above market forecasts.
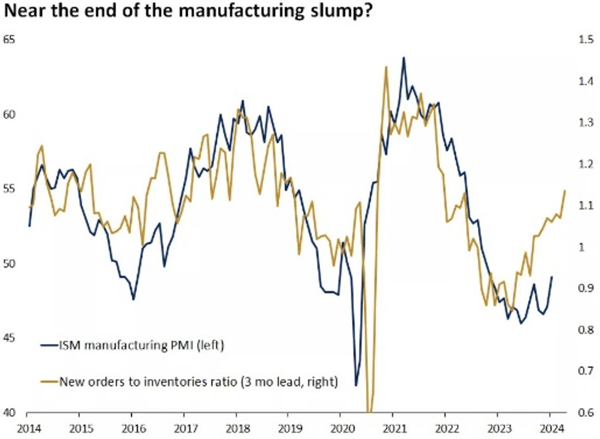
In addition, there are numerous signs the U.S. economy remains robust. The ISM Services reading remained in expansion mode, the ratio of ISM Manufacturing new orders to inventories continued to increase (see chart below), month-over-month retail sales for December were up a strong 0.6%, and excluding auto, gas, building materials and food - so called core retail sales – were up an even stronger 0.8%. Durable goods orders, excluding the volatile transportation segment, rose 0.6% in December, on top of a 0.5% increase in November. Initial jobless claims continue to flatline from a longer-term perspective with wage gains, as measured by average hourly earnings, advancing a healthy 4.5% over the past 12 months. The University of Michigan Consumer Sentiment Index was revised higher to 79, the highest since July 2021.
More important for markets, forward-looking measures of economic growth as captured by the Atlanta Fed’s GDPNow tracker, continued to surprise on the upside, with real GDP Growth for Q1 2024 estimated at 3.4%, far from recessionary territory. Little surprise then, interest rates reversed their recent decline and await new data for direction.
Source: Bloomberg, Edward Jones
Federal Reserve and Monetary Policy: In his latest press conference, Chairman Powell took pains to signal market participants that while the Fed recognized much had been done in its efforts to reduce inflation to its long term goal of 2%, it was in no hurry to begin lowering rates (1/31/24). Given the economic data spelled out above, that appears to be the correct approach, as the weight of evidence indicates economic expansion continues without spurring a new bout of inflationary pressures, at least for now. Financial conditions remain quite loose and wage gains healthy, while at the same time labor productivity is coming in at higher than expected levels (see chart below):
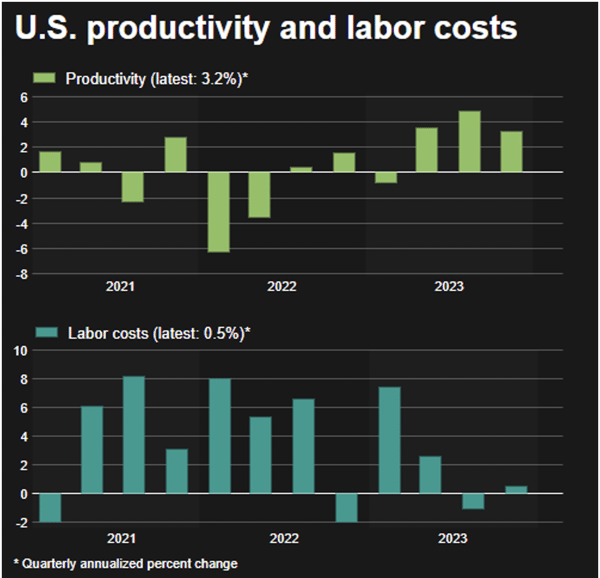
Source: LSEG Datastream - Reuters graphic/Stephen Culp. 01/02/2024
This is a happy juxtaposition and a primary reason why Chairman Powell exclaimed at his recent press conference “We don't look at it [economic growth] as a problem. I think, at this point, we want to see strong growth. We want to see a strong labor market. We're not looking for a weaker labor market” (1/31/24). On this point it is likely the Fed will get its wish as the U.S. economy continues to operate in an era of fiscal dominance, where the sheer amount of government spending stymies monetary efforts to slow the economy.
Managed Income Strategy
Manager Commentary: After a blistering fourth quarter, fixed income throttled down in January, with duration-sensitive assets drawing down, while US High Yield remained relatively flat. The Managed Income Strategy notched a slight positive month, driven by the allocation to high yield with supplementary senior loan/floating rate positions, which outperformed high yield during the month as yields crept up.
At present, the Managed Income Strategy remains in a “Risk-On” position, still fully allocated. While US High Yield has fallen back into somewhat of a rangebound state over the past few weeks, yields remain elevated, with the ICE BofA US High Yield Index reporting an effective yield of 7.59% at month end. As long as market volatility remains relatively low, we anticipate “Risk-On” will remain the dominant regime in the short term.
Dynamic Growth Strategy
Manager Commentary: The rally from the aftermath of November’s Federal Reserve meeting carried into the new year, as equities soared in January. The major indices marked new all-time highs, with optimism as the prevailing sentiment from market participants. During January, the Dynamic Growth Strategy remained fully invested in a “Risk-On” position, tilted toward growth equity, with supplementary positions in core equities. In addition, the Strategy has a tilt toward mega-cap growth stocks, as the so-called “Magnificent Seven” stocks (Apple, Amazon, Alphabet, Meta, Microsoft, Nvidia, and Tesla) continue to lead the market rally.
The current “Risk-On” trade for Dynamic Growth is entering its fourth month, and with market volatility remaining relatively low, we anticipate “Risk-On” will stay the dominant regime for the foreseeable future. Historically, the second half of February is poor for equities seasonally. We will be intently watching to see how stocks perform through this relatively weak period, and as always, we remain ready to shift to a “Risk-Off” positioning should equities falter.
Active Advantage Strategy
Manager Commentary: As markets trended higher in January, the Active Advantage Strategy remained positioned in a full “Risk-On” state, with a balanced position between fixed income and equities. As rates climbed, the Strategy overweighted its equity positions, pushing the equity allocation over 60%, with fixed income less than 40%. This move was designed to take advantage of continued stability in equities, with volatility remaining low.
In our view, we believe managing interest rate risk is still important. Despite the broader sentiment from market participants that multiple rate cuts are on the table in 2024, the Federal Reserve remains data-dependent; therefore, any unexpected data, particularly with respect to employment and inflation figures, could cause sudden moves in duration-sensitive fixed income. For this reason, Active Advantage remains overweight US High Yield in its fixed income allocation.
Defender Strategy
Manager Commentary: January was yet another month where US equity indices, specifically Big Tech stocks, continued to drive stock market returns while the broader markets lagged. For the Kensington Defender Strategy, the biggest detractors from performance were US Small Caps and non-US stocks, which also dropped during the month. Despite those detractors, the Strategy ended positive for the month due to the Nasdaq 100 exposure as well as additional gains from the Strategy’s options overlay system. We continue to maintain our outlook from the beginning of the year highlighted by our expectation of slower economic growth in 2024. Our assessment that the market had jumped the gun on Fed rate cuts seems to be resonating, as expectations for a March rate cut have fallen, which means some duration diversity in the Risk-Off position of the Defender Strategy will be prudent for the first quarter of 2024. The monthly momentum story may very well prove to be valuable in the coming months as markets begin to digest economic and earnings data.
Click below to subscribe to our Insights!
Receive email notifications when new articles are published

Disclaimers:
Investing involves risk, including loss of principal. Past performance does not guarantee future results. There is no guarantee any investment strategy will generate a profit or prevent a loss.
This is for informational purposes only and is not a recommendation nor solicitation to buy, sell or invest in any investment product or strategy. Our materials may contain information deemed to be correct and appropriate at a given time but may not reflect our current views or opinions due to changing market conditions. No information provided should be viewed as or used as a substitute for individualized investment advice. An investor should consider the investment objectives, risks, charges, and expenses of the investment and the strategy carefully before investing.
Kensington Asset Management, LLC (“KAM”) relies on third party sources for some of its information that we believe is reliable. However, we make no representation, warranty, endorse or affirm as to its accuracy or completeness. The information provided is current as of the date of publication and may be subject to change. We are not responsible for updating this information to reflect any subsequent developments or events.
Any indices and other financial benchmarks shown are provided for illustrative purposes only, are unmanaged, reflect reinvestment of income and dividends and do not reflect the impact of advisory fees. Investors cannot invest directly in an index. Comparisons to indexes have limitations because indexes have volatility and other material characteristics that may differ from a particular strategy such as the types of securities being substantially different.
Certain information contained herein constitutes “forward-looking statements,” which can be identified using forward-looking terminology such as “may,” “will,” “should,” “expect,” “anticipate,” “project,” “estimate,” “intend,” “continue,” or “believe,” or the negatives thereof or other variations thereon or comparable terminology. Due to various risks and uncertainties, actual events, results, or actual performance may differ materially from those reflected or contemplated in such forward-looking statements. Nothing contained herein may be relied upon as a guarantee, promise, assurance, or a representation as to the future.
Advisory services offered through Kensington Asset Management, LLC, Barton Oaks Plaza, Bldg II, 901 S Mopac Expy – Ste 225, Austin, TX 78746.
Managed Income Strategy
Risks specific to the Managed Income Strategy include Management Risk, High-Yield Risk, Fixed-Income Security Risk, Foreign Investment Risk, Loans Risk, Market Risk, Underlying Funds Risk, Non-Diversification Risk, Turnover Risk, U.S. Government Securities Risk, LIBOR Risk, Models and Data Risk.
Dynamic Growth Strategy
Risks specific to the Dynamic Growth Strategy include Management Risk, Equity Securities Risk, Market Risk, Underlying Funds Risk, Non- Diversification Risk, Small and Mid-Capitalization Companies Risk, Turnover Risk, U.S. Government Securities Risk, Models and Data Risk.
Active Advantage Strategy
Risks specific to the Active Advantage Strategy include Management Risk, Equity Securities Risk, High-Yield Risk, Fixed-Income Security Risk, Foreign Investment Risk, Loans Risk, Market Risk, Underlying Funds Risk, Limited History of Operations Risk, Non-Diversification Risk, Small and Mid-Capitalization Companies Risk, Turnover Risk, U.S. Government Securities Risk, LIBOR Risk, Models and Data Risk.
Defender Strategy
Risks specific to the Defender Strategy are detailed in the prospectus and include general market risk, credit risk, interest rate risk, management risk, equity securities risk, fixed-income securities risk, high-yield bond risk, foreign investment risk, emerging markets risk, real estate and REITs risk, commodities risk, currency risk, subsidiary risk, market risk, underlying funds risk, derivatives risk, limited history of operations risk, turnover risk, models and data risk, momentum risk or risk of the portfolio not performing as expected.
Definition:
NASDAQ 100: A market index that comprises of the 100 largest, most actively traded companies listed on the Nasdaq stock exchange.
S&P 500: A capitalization weighted index of 500 stocks representing all major domestic industry groups. The S&P 500 TR Index assumes the reinvestment of dividends and capital gains.
Russell 2000 Index: A market index that consists of 2,000 small-cap U.S. companies that are part of the larger Russell 3000 Index.
Euro Stoxx Index: A market capitalization-weighted stock index that represents the 50 largest blue-chip European companies operating within the eurozone nations
MSCI EAFE Index: An international equities market index that consists of large and mid-cap stocks across developed markets in Europe, Australasia, and Far East Asia. Excludes US and Canadian stocks.
ICE BofA US High Yield Index: A unmanaged bond index that tracks the performance of US dollar denominated below investment grade rated corporate debt publicly issued in the US domestic market.