

Geopolitics: Japan’s long-running modern monetary experiment appears to have reached a major turning point, one that may have serious ramifications for financial markets going forward. The Bank of Japan announced in late July it would increase its threshold level as an assured buyer of its country’s 10-year bonds from 0.50% to a yield of 1.00%. At the same time, the Bank stated it still intended to maintain short-term rates in the range of 50 bps, but planned to increase its flexibility around this target. The move was essentially in reaction to higher than expected inflation with general price increases (over 4% YoY), reaching a four decade high earlier this year. Yields on Japanese Government Bonds (“JGBs”) immediately jumped on the news before backing off.
Japan plays a crucial role in markets in a number of ways. One, it is a source of cheap financing; its extremely low interest rates since yield curve control was instituted, combined with a relatively weak currency, has offered investors an attractive way to finance asset purchases in other countries. This well known “carry trade” has also played a meaningful role in the overall leveraging of balance sheets globally since the wind down of the Global Financial Crisis. Secondly, the Bank of Japan’s (“BoJ’s”) unlimited money printing has impelled Japanese institutions to look overseas in search of yield, most prominently in the U.S. bond market. Their buying has, in turn, been a source of major support for Treasury prices and allowed the U.S. government to finance fiscal deficits at lower interest rates than would otherwise be the case.
If the cost of borrowing in Japan increases markedly, it may well cause holders of both equities and bonds globally to pare back their borrowings, putting pressure on asset prices. In addition, Japan’s reduced participation in Treasury markets will likely put upward pressure on yields at a time when the U.S. government’s fiscal deficits are set to increase substantially.
The Treasury will be raising approximately $2 Trillion between now and year-end. The remarkable size of the financing coincides with the recent downgrade of U.S. debt from AAA to AA+ by Fitch, the second time the U.S. has been downgraded, the first by Standard & Poor’s in 2011. While Treasury officials were quick to dismiss the move as meaningless, history suggests higher borrowing costs may be in the offing. As Richard Bernstein & Associates pointed out in a recent note, “The 2011 US debt downgrade had a meaningful effect on the relative interest costs of U.S. Treasuries and, because debt in the economy prices off government debt, raised the cost of capital for the entire U.S. economy.”
U.S. vs Germany: 10-Yr Sovereign Debt Yield Spread
(Aug. 29, 1993 - Aug. 2, 2023)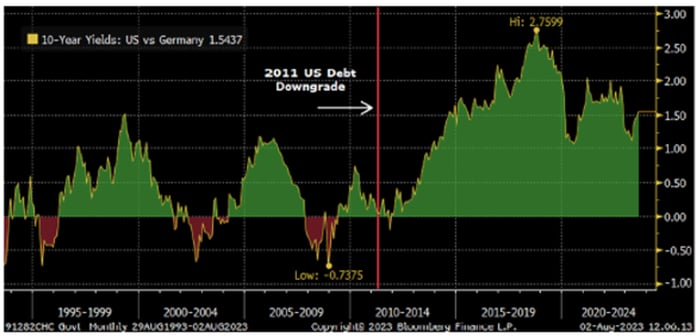
Source: Richard Bernstein Advisors LLC, Bloomberg Finance L.P.
The 30-year bond yield quickly reacted to news of the downgrade, jumping over 30 basis points in the span of a few days before retreating. The move in yields undoubtedly reflects the already fragile financial condition the U.S. finds itself in as is plainly seen in the chart below.
Deficits and Debt Interest of Countries Rated AAA or AA, 2023 Estimate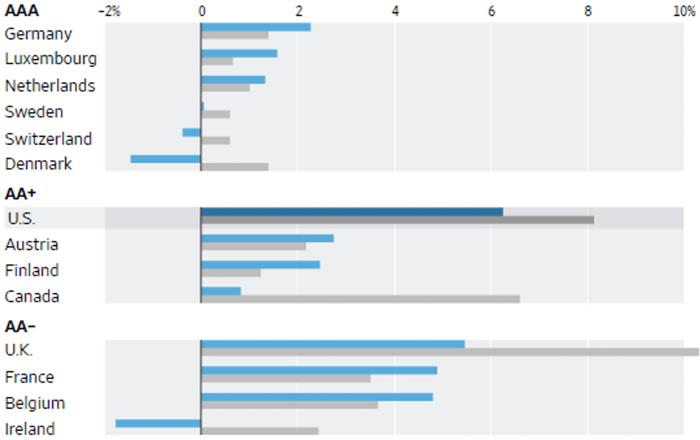
*Total government Negative denotes surplus.
Note: List excludes Norway (AAA) whose surplus. is 21% of GDP.
Source: Fitch Ratings
Stock Market: Equities continued to perform well in the month of July, with the rally broadening to include small and mid-capitalization companies. The S&P 500 Index1 gained 3.11% while the Nasdaq 100 Index2 was up 3.81%, both trailing the S&P 400 Midcap Index3 which advanced 4.05% with the small-cap Russell 2000 Index4 sprinting ahead, up 6.06%. Better than expected earnings were a major impetus for the positive performance. With 84% of the companies in the S&P 500 having reported results for Q2 2023 at month’s end, 79% reported Earnings Per Share (“EPS”) above estimates, above the 5-year average of 77% and the highest percentage since Q3 2021 (82%). Of course, much of that surprise can be ascribed to the tradition of company management guiding analyst projections down earlier in a quarter, setting up the high percentage of earnings beats seen in the data.
This is not to denigrate what were admirable results in the face of slowing overall industrial demand. The Manufacturing Purchasing Managers’ Index (“PMI”)5 continues to be a concern, remaining under 50% for the ninth consecutive month. A resilient services economy and the huge fiscal impulse from government spending is carrying the day much to the surprise of most forecasters.
Even in the face of slowing sales, corporate managers have been able to maintain profitability. Profit margins peaked in 2021 Q2 (12.9%) and then declined for six consecutive quarters to 10.7% before rising to 11.2% in 2023 Q1. Q2 margins, when fully reported, should come in at or slightly below that level, commendable performance in light of Q2 revenue growth (YoY) of only 0.4% amid rising wage and input costs.
S&P 500 Profit Margin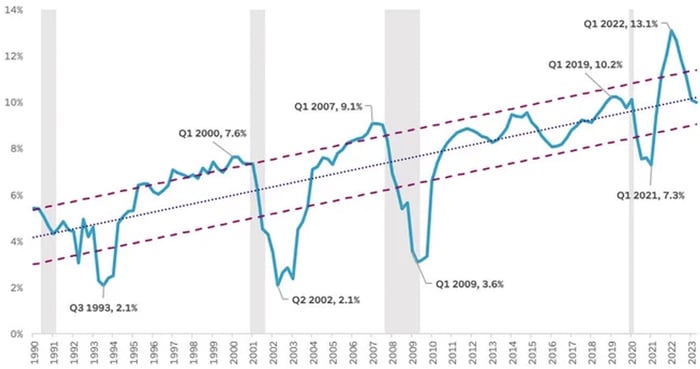
Source: SoFi, Bloomberg. Gray bars represent recessions. Dotted line represents 1990-present trend line.
Dashed lines represent +/- 0.6 standard deviations from the long-term trend line.
Looking forward, a useful indicator of market strength is the relative performance of cyclical vs defensive stocks. At a time when many have warned a recession is in the offing, the market is suggesting otherwise as can be seen in the chart below.
Cyclicals vs Defensives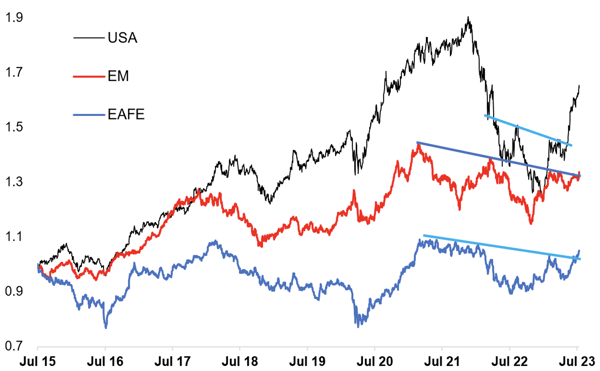
Source: Topdown Charts, Refinitiv Datastream, MSCI
At a time when China’s economy continues to sputter, it is surprising to see global cyclicals break out - or threaten to - of two year downtrends. For now, it remains a U.S.-centric story but if emerging market and EAFE6 stocks join in, it will be an important bullish tell.
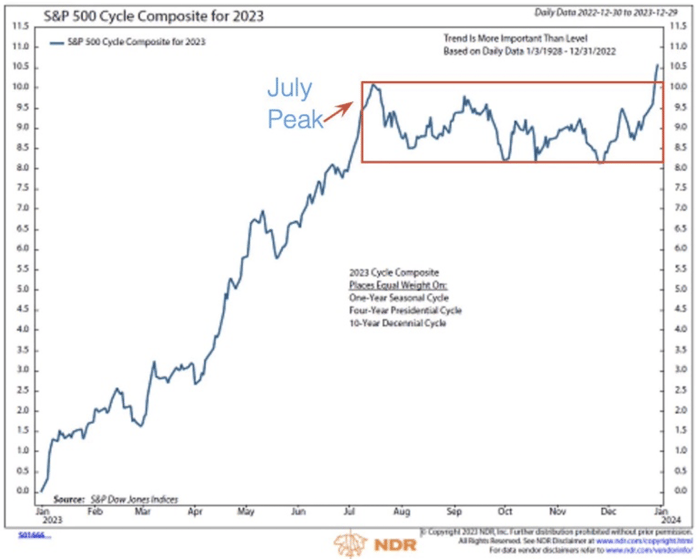
Seasonally, we are in a pre-election year which historically has been quite positive for equities with the caveat that the third quarter of the year has been the period when markets can turn bumpy. So far, 2023 has followed the script almost perfectly.
Fixed Income: Fixed income markets were mixed in July, with purely rate sensitive indices such as the 10-year Treasury Note returning a negative -0.82%, corporate investment grade bonds gaining 0.34% and more credit sensitive high yield bonds outpacing both, up 1.38%.
We have commented previously about the surprising resilience in lower rated credits (high yield spreads having approached cycle lows last month). One of the main reasons is the dollar amount of speculative-grade instruments coming up for refinancing is quite small, both this year and next.
Maturity Scheduled for U.S. Nonfinancial Corporations ($B)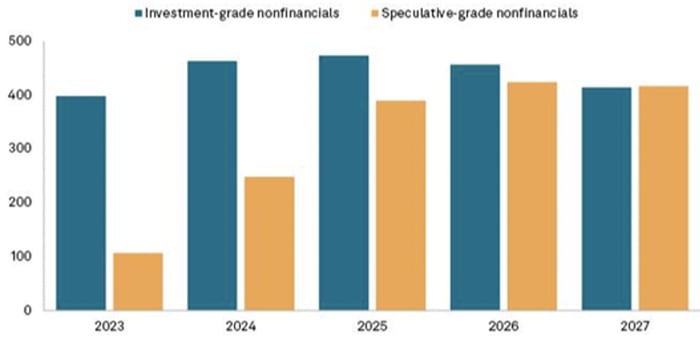
Date as of Jan. 1, 2023.
Includes bonds, loans, and revolving credit facilities that are rated by S&P Global Ratings.
Excludes debt instruments that do not have a global scale rating.
Source: S&P Global Ratings Credit Research & Insights.
With issuance muted and demand for yield healthy, the sector has been able to avoid, for now at least, any refinancing issues even as absolute rates move higher. There is little question, however, underlying pressures are building as evidenced by the jump in bankruptcies over the past year. As the maturity schedule builds in 2025 and beyond, prospectively higher rates will put a great deal of pressure on leveraged balance sheets.
A recent Goldman Sachs research report entitled “The Corporate Debt Maturity Wall” points out that “Refinancing needs will remain historically low over the next two years - about 16% of corporate debt will mature over the next two years. The interest rate on refinanced corporate debt will increase substantially because current market rates are roughly 1½ percentage points above the average rate that companies are paying on existing investment grade bonds and 2 percentage points above the average rate on high yield bonds”.
Corporations took advantage of the Fed’s easy money policy both before and during the pandemic to refinance a significant amount of debt, making them better equipped to weather a rising rate regime. This has, in part, mitigated the Fed’s efforts to slow the economy and at the same time, kept credit spreads lower than they might otherwise be.
While corporate maturities are less demanding over the next year or so, the same can’t be said for U.S. Treasuries which, as previously mentioned, face a heavy issuance calendar for the rest of the year. Most of the issuance will be in bills with the expectation money market funds, flush with cash from their disintermediation of bank deposits, will be ready buyers.
The Federal Reserve and Monetary Policy: As expected, the Federal Open Market Committee (“FOMC”) raised the Federal Funds rate another 25 basis points in July, upping the policy range to 5.25-5.50%. The action was taken in recognition of a surprisingly strong economy (the Atlanta Fed’s GDPNow forecast for real GDP in Q3 is 4.1%) and the fact that prices, while down considerably from their peak, remain above the Fed’s long-term goal of two percent.
One piece of good news we have alluded to before but is worth mentioning again is shelter costs. As evidenced in the chart below, they will be coming down dramatically over the next several months providing meaningful inflation relief, even as the price of other goods and services flat line or possibly increase.
CPI Rent Inflation Will Continue Cooling as Peak Hikes Drop Out of YoY calcs
(Month-Over-Month Change in CPI Rent of Primary Residence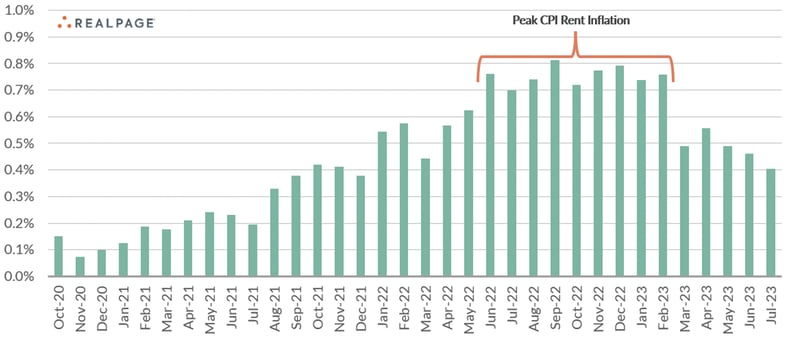
Source: Federal Reserve Economics Data (FRED) & BLS
Managed Income Strategy
During the month of July, US High Yield remained stable, with positive returns across the sector. The Managed Income portfolio remains tilted heavily to US High Yield, with a supplementary position in floating rate and investment grade corporate debt. We anticipate Managed Income to remain in a “Risk- On” posture as long as current conditions persist, as conditions are still favorable to receive the higher coupon payments the sector offers, with rangebound price movement in the sector as of late. While conditions remain favorable at this point, we are heading into a period of seasonal market volatility. Should conditions deteriorate, it is possible we could see Managed Income reverting back to a “Risk-Off” posture.
Dynamic Growth Strategy
Continued positive trends in US equities led to no position changes for Dynamic Growth in July, which maintained a fully invested position for the entirety of the month. Growth equities, in particular, continued to lead the charge as tech and megacap stocks continued to perform to the upside. As we enter August and September, we are watching for seasonal volatility patterns to take hold. Historically, August and September have exhibited positive trends in volatility, which could pose a threat to the current market run. In addition, rising rates and slowing economic growth could result in additional headwinds. Should this rally exhaust itself, we would anticipate Dynamic Growth to revert back to a “Risk-Off” posture and take a pause to assess the overall trend. As of month-end, Dynamic Growth remained fully invested; however, subsequent to the end of the month, the Dynamic Growth model did produce a “Risk-Off” signal as August began.
Active Advantage Strategy
The Active Advantage strategy spent the month of July in a fully invested, balanced portfolio, with approximately 60% in equities and 40% in fixed income, as general market trends remained favorable. As noted above, we are paying close attention to seasonal volatility patterns, which could result in decreased exposure for the strategy. However, as of now, general trends in US High Yield—Active Advantage’s largest fixed income allocation—remain stable. We anticipate remaining in the current balanced position if trends across core equities and fixed income retain stability.
Defender Strategy
The Defender Strategy saw an increase in overall market momentum entering the month of August, shifting overall market exposure to 90%, from 75% the month prior. Entering August the Strategy is allocated to six asset classes: US Large Growth and Core Equities, US Small Cap Equities, European Equities, Japanese Equities, and Emerging Markets, as well as the Strategy’s Option Overlay Strategy for income generation.
1The S&P 500 is a stock market index that tracks the stock performance of 500 of the largest companies listed on stock exchanges in the United States.
2The Nasdaq 100 is a stock market index made up of 101 equity securities issued by 100 of the largest non-financial companies listed on the Nasdaq stock exchange.
3The S&P 400 is a stock market index that serves as a gauge for the U.S. mid-cap equities sector and is the most widely followed mid-cap index.
4The Russell 2000 is a small-cap U.S. stock market index that makes up the smallest 2,000 stocks in the Russell 3000 Index.
5The Purchasing Managers’ Index is an index of the prevailing direction of economic trends in the manufacturing and service sectors.
6The MSCI EAFE Index is a stock market index that is designed to measure the equity market performance of developed markets outside of the U.S. & Canada.
Click below to subscribe to our Insights!
Receive email notifications when new articles are published

Investing involves risk. Principal loss is possible.
Risks specific to the Managed Income Strategy include Management Risk, High-Yield Risk, Fixed-Income Security Risk, Foreign Investment Risk, Loans Risk, Market Risk, Underlying Funds Risk, Non-Diversification Risk, Turnover Risk, U.S. Government Securities Risk, Interest Rate Risk, Models and Data Risk.
Risks specific to the Dynamic Growth Strategy include Management Risk, Equity Securities Risk, Market Risk, Underlying Funds Risk, Non-Diversification Risk, Small and Mid-Capitalization Companies Risk, Turnover Risk, U.S. Government Securities Risk, Models and Data Risk.
Risks specific to the Active Advantage Strategy include Management Risk, Equity Securities Risk, High-Yield Risk, Fixed- Income Security Risk, Foreign Investment Risk, Loans Risk, Market Risk, Underlying Funds Risk, Limited History of Operations Risk, Non-Diversification Risk, Small and Mid-Capitalization Companies Risk, Turnover Risk, U.S. Government Securities Risk, Interest Rate Risk, Models and Data Risk.
Risks specific to the Defender Strategy include general market risk, credit risk, interest rate risk, management risk, equity securities risk, fixed-income securities risk, high-yield bond risk, foreign investment risk, emerging markets risk, real estate and REITs risk, commodities risk, currency risk, subsidiary risk, market risk, underlying funds risk, derivatives risk, limited history of operations risk, turnover risk, models and data risk, momentum risk or risk of the portfolio not performing as expected.
There is no guarantee that the investment objectives will be achieved. Moreover, the past performance is not a guarantee or indicator of future results. The investment return and principal value of an investment will fluctuate so that an investor’s shares, when redeemed, may be worth more or less than their original cost.
This is for informational purposes only and should not be construed as a solicitation to buy or sell, or to invest in any investment product or strategy. Investing in securities markets involves risk and the degree of risk varies by the type of investment or strategy. For a complete list of the risks associated with each of our Strategies, please review the Strategy Brochure and Factsheet. Materials such as blog posts, newsletters or commentary may contain information deemed to be correct and appropriate at a given time but may not reflect our current views or opinions due to changing market conditions. No information provided should be viewed as, or used as a substitute for individualized investment advice.
This document does not constitute advice or a recommendation or offer to sell or a solicitation to deal in any security or financial product. It is provided for information purposes only and on the understanding that the recipient has sufficient knowledge and experience to be able to understand and make their own evaluation of the proposals and services described herein, any risks associated therewith and any related legal, tax, accounting or other material considerations. To the extent that the reader has any questions regarding the applicability of any specific issue discussed above to their specific portfolio or situation, prospective investors are encouraged to contact the professional advisor of their choosing.
Certain information contained herein has been obtained from third party sources and such information has not been independently verified by Kensington Asset Management, LLC (“KAM”). No representation, warranty, or undertaking, expressed or implied, is given to the accuracy or completeness of such information by KAM or any other person. While such sources are believed to be reliable, KAM does not assume any responsibility for the accuracy or completeness of such information. KAM does not undertake any obligation to update the information contained herein as of any future date.
Any indices and other financial benchmarks shown are provided for illustrative purposes only, are unmanaged, reflect reinvestment of income and dividends and do not reflect the impact of advisory fees. Investors cannot invest directly in an index. Comparisons to indexes have limitations because indexes have volatility and other material characteristics that may differ from a particular strategy. For example, a strategy may typically hold substantially fewer securities than are contained in an index.
Certain information contained herein constitutes “forward-looking statements,” which can be identified by the use of forward-looking terminology such as “may,” “will,” “should,” “expect,” “anticipate,” “project,” “estimate,” “intend,” “continue,” or “believe,” or the negatives thereof or other variations thereon or comparable terminology. Due to various risks and uncertainties, actual events, results or actual performance may differ materially from those reflected or contemplated in such forward-looking statements. Nothing contained herein may be relied upon as a guarantee, promise, assurance or a representation as to the future.
Definitions:
Equity Securities Risk: The Fund may invest in or have exposure to equity securities. Equity securities may experience sudden, unpredictable drops in value or long periods of decline in value. This may occur because of factors that affect securities markets generally or factors affecting specific industries, sectors, geographic markets, or companies in which the Fund invests.
Fixed-Income Security Risk: The Fund may invest in or have exposure to fixed-income securities. Fixed-income securities are or may be subject to interest rate, credit, liquidity, prepayment and extension risks. Interest rates may go up resulting in a decrease in the value of fixed-income securities. Credit risk is the risk that an issuer will not make timely payments of principal and interest. There is also the risk that an issuer may “call,” or repay, its high yielding bonds before their maturity dates. Fixed-income securities subject to prepayment can offer less potential for gains during a declining interest rate environment and similar or greater potential for loss in a rising interest rate environment. Limited trading opportunities for certain fixed-income securities may make it more difficult to sell or buy a security at a favorable price or time. Changes in market conditions and government policies may lead to periods of heightened volatility and reduced liquidity in the fixed income securities market, and could result in an increase in redemptions. Interest rate changes and their impact on a fund and its share price can be sudden and unpredictable.
Foreign Investment Risk: Foreign investments may be riskier than U.S. investments for many reasons, such as changes in currency exchange rates and unstable political, social, and economic conditions.
High-Yield Risk: Lower-quality fixed income securities, known as “high-yield” or “junk” bonds, present greater risk than bonds of higher quality, including an increased risk of default. These securities are considered speculative. Defaulted securities or those subject to a reorganization proceeding may become worthless and are illiquid.
LIBOR Risk: Changes related to the use of the London Interbank Offered Rate (LIBOR) or similar interbank offered rates (“IBORs,” such as the Euro Overnight Index Average (EONIA)) could have adverse impacts on financial instruments that reference LIBOR or a similar rate. While some instruments may contemplate a scenario where LIBOR or a similar rate is no longer available by providing for an alternative rate setting methodology, not all instruments have such fallback provisions and the effectiveness of replacement rates is uncertain. The abandonment of LIBOR and similar rates could affect the value and liquidity of instruments that reference such rates, especially those that do not have fallback provisions. The use of alternative reference rate products may impact investment strategy performance.
Limited History of Operations Risk: The Fund has a limited history of operations for investors to evaluate. The Fund may fail to attract sufficient assets to operate efficiently.
Loans Risk: The market for loans, including bank loans, loan participations, and syndicated loan assignments may not be highly liquid, and the holder may have difficulty selling them. These investments expose the Fund to the credit risk of both the financial institution and the underlying borrower. Bank loans settle on a delayed basis, which can be greater than seven days, potentially leading to the sale proceeds of such loans not being available for a substantial period of time after the sale of the bank loans.
Management Risk: The Adviser’s reliance on its proprietary trend-following model and the Adviser’s judgments about the attractiveness, value, and potential appreciation of particular assets may prove to be incorrect and may not produce the desired results.
Market Risk: Overall investment market risks affect the value of the Fund. Factors such as economic growth and market conditions, interest rate levels, and political events affect U.S. and international investment markets. Additionally, unexpected local, regional or global events, such as war; acts of terrorism; financial, political or social disruptions; natural, environmental or man-made disasters; the spread of infectious illnesses or other public health issues (such as the global pandemic coronavirus disease 2020 (COVID-19)); and recessions and depressions could have a significant impact on the Fund and its investments and may impair market liquidity. Such events can cause investor fear, which can adversely affect the economies of nations, regions and the market in general, in ways that cannot necessarily be foreseen.
Models and Data Risk: The Fund’s investment exposure is heavily dependent on proprietary quantitative models as well as information and data supplied by third parties (“Models and Data”). When Models and Data prove to be incorrect or incomplete, any decisions made in reliance thereon may lead to securities being included in or excluded from the Fund’s portfolio that would have been excluded or included had the Models and Data been correct and complete. Some of the models used by the Fund are predictive in nature. The use of predictive models has inherent risks. For example, such models may incorrectly forecast future behavior, leading to potential losses. In addition, in unforeseen or certain low-probability scenarios (often involving a market disruption of some kind), such models may produce unexpected results, which can result in losses for the Fund.
Non-Diversification Risk: As a non-diversified fund, the Fund may invest more than 5% of its total assets in the securities of one or more issuers. The Fund also invests in underlying funds that are non-diversified. The Fund’s performance may be more sensitive to any single economic, business, political or regulatory occurrence than the value of shares of a diversified investment company.
Small and Mid-Capitalization Companies Risk: Investing in or having exposure to the securities of small-capitalization and mid-capitalization companies involves greater risks and the possibility of greater price volatility than investing in larger capitalization and more-established companies. Investments in mid-cap companies involve less risk than investing in smallcap companies. Smaller companies may have limited operating history, product lines, and financial resources, and the securities of these companies may lack sufficient market liquidity. Mid-cap companies often have narrower markets and more limited managerial and financial resources than larger, more established companies.
Turnover Risk: A higher portfolio turnover may result in higher transactional and brokerage costs. The Fund’s portfolio turnover rate may be significantly above 100% annually
Underlying Funds Risk: Investments in underlying funds involve duplication of investment advisory fees and certain other expenses. Each underlying fund is subject to specific risks, depending on the nature of its investment strategy. The manager of an underlying fund may not be successful in implementing its strategy. ETF shares may trade at a market price that may be lower (a discount) or higher (a premium) than the ETF’s net asset value. ETFs are also subject to brokerage and/or other trading costs, which could result in greater expenses to the Fund. Because the value of ETF shares depends on the demand in the market, the Adviser may not be able to liquidate the Fund’s holdings at the most optimal time, adversely affecting performance.
U.S. Government Securities Risk: The Fund may invest directly or indirectly in obligations issued by agencies and instrumentalities of the U.S. government. The U.S. government may choose not to provide financial support to U.S. government sponsored agencies or instrumentalities if it is not legally obligated to do so, in which case, if the issuer defaulted, the Fund might not be able to recover its investment.
Advisory services offered through Kensington Asset Management, LLC.