

Geopolitics: Researchers from Goldman Sachs recently issued a 20-page report on generative artificial intelligence/ChatGPT and concluded the technology has matured to a point it will likely have a dramatic and substantive effect on global economic growth and labor markets in the decade ahead. Goldman forecasts that over 300 million jobs in the U.S. and Europe may be displaced by automation, a full one-quarter of the entire labor force. While this will no doubt be a wrenching transition for individuals, the report posits the combination of significant labor cost savings, new job creation, and higher productivity for non-displaced workers will lay the groundwork to substantially boost productivity. According to the report, annual U.S. labor productivity growth could increase as much as 1.5% per month over a 10-year period following widespread adoption and increase global economic growth by 7% annually.
If accurate, there would be staggering increases in both positive (and negative) outcomes and is suggestive of other major human inventions in its impact, such as the printing press, vaccines, and the light bulb; in other words, artificial intelligence in its current incarnation now has the potential to significantly change the course of human history. The impact of this will be momentous and the path forward will require the input and cooperation of all countries, a difficult undertaking since AI will likely be viewed by competing nations as a means for one to gain advantage over the other.
Stock market: In March, large-capitalization stocks led the market higher, with the S&P 500 Index1 gaining 3.51% and the tech heavy Nasdaq 100 Index2 up 9.46%. In contrast, the small-cap Russell 2000 Index3 fell -4.98%. For the quarter, the S&P 500 Index was up 7.03% while the Nasdaq 100 Index advanced an impressive 20.49%. Small-caps lagged, advancing 2.34%.
The strong performance from the large-cap sector was driven by a strikingly few familiar names (Apple, Nvidia, Microsoft, Amazon, Tesla and Google). If those six stocks were excluded, the S&P 500 Index would have been flat for the quarter. Lower interest rates and overall investor caution pushed many investors into safe-haven stocks, ones whose secular growth story and/or large balance sheets were somewhat immune to a slowing economic environment.
Small-cap stocks suffered by comparison, with much of the drag emanating from the banking crisis that affected mid and small-size banks in March. The banking crisis seems to have abated for now as the Fed quickly moved to guarantee uninsured deposits, while providing much needed liquidity to banks holding stressed securities portfolios.
The travails of banks caught up in the maelstrom has been widely commented on, but suffice it to say in nearly all cases the blame can largely be attributed to poor risk management. The practice of making long-term loans backed by short-term bank deposits always carries with it interest rate risk. When the Federal Reserve clearly indicated its intention in 2022 to embark on a tightening regime to slow the economy it was signaling to banks and other holders of long duration assets it was time to take the necessary steps to insulate themselves from a higher rate environment. The fact that many failed to do so was clearly a major unforced error and explains the failure of Silicon Valley Bank, which in turn sparked wide-spread concern about the health of the financial system.
Looking forward, earnings will be the primary focus of investors as most companies report Q1 2023 this month and offer guidance for the rest of the year. Since the effect of rate hikes tends to lag by several months, this quarter’s reports will provide new and important insight into the steepness and duration of the earnings recession we are already in.
Fixed Income: Fixed income indices generated a positive performance in March with longer duration Treasuries a particular standout. The 30-year Treasury returned a robust 4.62% while the 10-year Treasury gained 3.88%. Credit sensitive indexes were up as well with the Bloomberg U.S Corporate Investment Grade Index4 up 2.78% and lower rated high yield bonds, the Bloomberg U.S. Corporate High Yield Index5, up 3.57%.
The elevated volatility seen in fixed income markets receded in March as inflation numbers came in at or beneath expectations. With the aforementioned bank mini-crisis and weakening economic data both serving to dampen future growth expectations, rates fell precipitously with the 2-year Treasury yield falling from over 5% to under 3.8% (after having risen 80 basis points the month before).
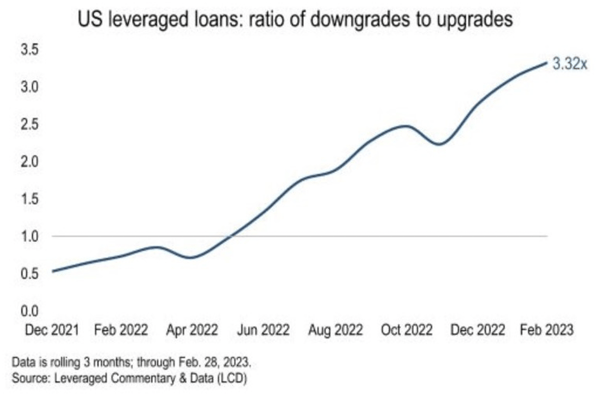
We have remarked in the past how well-behaved credit spreads have been, particularly high yield spreads. Even as many are calling for recessionary conditions this year, credit markets are not (yet) evidencing increasing stress. But as with earnings projections, the impact from policy tightening takes time to evidence itself, which could mean we are at the cusp of a less benign credit environment. Hiccups generally occur first in the lower grade issues and as one can see below, we are beginning to see signs of stress in the leveraged loan market where the ratio of downgrades versus upgrades has moved inexorably higher.
Together with the commercial real estate debt sector - which is likely to be ground zero in the current credit cycle - the stability of these loans and their issuers’ ability to refinance at economic rates will be a determinant of the depth and duration of the current slowdown. In the meantime, bond volatility has subsided in recent weeks and higher yielding fixed income securities offer an attractive yield for as long as prices remain stable.
The Federal Reserve and Monetary Policy: Recent ISM service reports indicate that the manufacturing side of the economy is slowing, providing further evidence that Federal Reserve (“Fed”) policy is having the desired effect of slowing the economy and, by association, reducing upward pressure on the general price level. However, inflation is still running way ahead of the Fed’s 2-3% target level, posing a dilemma for the Federal Open Market Committee (“FOMC”) as to whether the rate level is high enough to sufficiently reduce aggregate demand but not so high as to risk a deep recession.
The market is pricing in one more 25 basis point hike and a series of ensuing rate cuts later this year. However, the 2-year Treasury is suggesting the bank crisis in March marked the peak in short-term rates for the cycle and a 25 basis point hike is unnecessary.
Looking forward investors will need to grapple with how sticky prices will prove to be and thus how long the Fed will remain tight. One indicator that suggests the road to 2% inflation may be bumpy is the Atlanta Fed’s sticky price indicator. This indicator is a weighted basket of consumer items that change price relatively slowly and includes the cost of goods such as owner-equivalent rent, food away from home, household furnishings and medical care services. It increased 4.5% (annualized in March) and 6.5% over the past 12 months. Contrast this with the basket of flexible items within the Consumer Price Index (“CPI”) - those items that change price relatively frequently - which decreased 9.6% (annualized) in March and is up 1.6% on a year-over-year basis. Because sticky price items change less frequently in price, they are more likely to incorporate expectations about future inflation. For now, it suggests inflation will remain elevated for some time to come.
Managed Income Strategy
Managed Income remained in a Risk-Off stance throughout the month of March, avoiding the volatility in the US High Yield market created by downward pressure in the banking sector. The Strategy stayed in all cash throughout the month, despite the subsequent flight to quality, as investment grade credit and Treasuries chopped along after an initial bounce from the banking crisis.
Dynamic Growth Strategy
Dynamic Growth entered a Risk-On posture mid-month on the strength of the first quarter equity rally and remained Risk-On for the remainder of the month. The portfolio held an overweight allocation to growth stocks during the month, riding the asset class’s strength since the beginning of the year.
Active Advantage Strategy
Active Advantage remained conservatively postured throughout the month due to downside risk and volatility. The Strategy shifted between a fully Risk-Off position and a 20% growth equity position (80% cash) throughout the month, accruing yield from our cash equivalent positions while preserving capital.
Click below to subscribe to our Insights!
Receive email notifications when new articles are published

1The S&P 500 Index, or Standard & Poor’s 500 Index, is a market-capitalization-weighted index of 500 leading publicly traded companies in the U.S.
2The Nasdaq 100 Index is a basket of the 100 largest, most actively traded U.S. companies listed on the Nasdaq stock exchange. The index includes companies from various industries except for the financial industry, like commercial and investment banks.
3The Russell 2000 Index is a stock market index that measures the performance of the 2,000 smaller companies included in the Russell 3000 Index.
4The Bloomberg U.S. Corporate Bond Index measures the investment grade, fixed-rate, taxable corporate bond market.
5The Bloomberg U.S. Corporate High Yield Index is comprised of domestic and corporate bonds rated Ba and below with a minimum outstanding amount of $150 million.
Investing involves risk. Principal loss is possible.
Risks specific to the Managed Income Strategy include Management Risk, High-Yield Risk, Fixed-Income Security Risk, Foreign Investment Risk, Loans Risk, Market Risk, Underlying Funds Risk, Non-Diversification Risk, Turnover Risk, U.S. Government Securities Risk, LIBOR Risk, Models and Data Risk.
Risks specific to the Dynamic Growth Strategy include Management Risk, Equity Securities Risk, Market Risk, Underlying Funds Risk, Non-Diversification Risk, Small and Mid-Capitalization Companies Risk, Turnover Risk, U.S. Government Securities Risk, Models and Data Risk.
Risks specific to the Active Advantage Strategy include Management Risk, Equity Securities Risk, High-Yield Risk, Fixed-Income Security Risk, Foreign Investment Risk, Loans Risk, Market Risk, Underlying Funds Risk, Limited History of Operations Risk, Non-Diversification Risk, Small and Mid-Capitalization Companies Risk, Turnover Risk, U.S. Government Securities Risk, LIBOR Risk, Models and Data Risk.
Past performance is no guarantee of future results. The investment return and principal value of an investment will fluctuate so that an investor’s shares, when redeemed, may be worth more or less than their original cost.
This is for informational purposes only and should not be construed as a solicitation to buy or sell, or to invest in any investment product or strategy. Investing in securities markets involves risk and the degree of risk varies by the type of investment or strategy. For a complete list of the risks associated with each of our Strategies, please review the Strategy Brochure and Factsheet. Materials such as blog posts, newsletters or commentary may contain information deemed to be correct and appropriate at a given time but may not reflect our current views or opinions due to changing market conditions. No information provided should be viewed as, or used as a substitute for individualized investment advice.
Advisory services offered through Kensington Asset Management, LLC.