


Geopolitics: Tensions continue to escalate in the Middle East as Israel prosecutes its counteroffensive against Hamas/Iran in the Gaza and Russia intensifies its attacks on the Ukraine. Most recently, and in reaction to Israel’s attack on its embassy in Damascus that targeted high ranking military commanders, Iran launched a major drone and missile strike at its neighbor. While none did significant harm, the action signaled that for the first time Iran was open to attacking Israel directly, a significant change in its military policy. Principally, because damage to Israel was minimal, the US has chosen to apply diplomatic pressure on its ally to de-escalate but it’s certain Israel will respond militarily in some fashion.
Not surprisingly, hot wars in the nexuses of oil production have affected the price of oil and since bottoming in December, crude has risen nearly 30%, fast approaching multi-month highs. Also serving to bolster prices has been a series of supply cuts by OPEC+, Mexico and the UAE. The US Energy Information Administration, which had previously forecast oil inventories would remain unchanged in Q2 2024, now predicts global inventories will fall by 900,000 barrels a day in the second quarter, approximately the production of Oman.
The market has been mindful of these developments, of course, and with oil prices at month end quite extended they may be due for a pullback, barring a major attack on global petrochemical facilities. First, higher prices tend to curtail economic activity and market demand, eventually resulting in a drop in price. Second, there will be every incentive for the US Administration to bring prices down in view of the November election. Finally, positioning by traders is very one sided as can be seen in the graph below.
Exhibit 2: The Crude Oil Rally Has Coincided With a Large Increase in Speculative Positioning
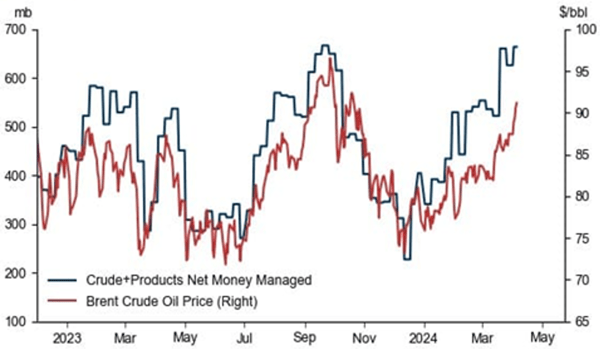
Source: ICE, CFTC, Refinitiv Eikon, Goldman Sachs Global Investment Research | As of April 5, 2024
Stock Market: Large-cap domestic equities, defined as the S&P 500 index, registered another strong month and quarter, ending up 3.10% and 10.16% respectively. The small-cap Russell 2000 index performed even better, up 3.39% in March and 4.81% for the quarter. The month’s laggard, the mega-cap technology laden Nasdaq 100, still advanced 1.17% in March and is up 8.49% year to date, continuing its strong run of outperformance. Overseas markets performed even better in March, with the Euro Stoxx 50 up 4.22% in the month and 12.43% in the quarter, while the MSCI EAFE (Europe, Africa and the Far East) gained 4.0% and 9.96% for the three months. This is the first time in some while foreign markets have outperformed their US counterparts, and in the case of Europe, was likely driven by the increasing likelihood the ECB will move to cut rates in advance of the Federal Reserve on the back of increasingly positive EU inflation news.
Equity markets were relatively range bound for most of March until the release of the Federal Reserve’s FOMC minutes and the press conference that followed. In response to a question, Chairman Powell re-iterated inflation data was moving in a positive direction and while the Fed wasn’t ready to cut short-term rates just yet, his expectation was such a move was not far off, on the assumption the data continued to trend toward the desired 2% long-term rate.
Investors chose to interpret these comments as bullish, even given Powell’s caveat, preferring to bet the Fed was indeed on track to cut rates three times in 2024. The premise of lower interest rates was sufficient to push equities higher, spurred on as portfolio managers bought going into the important quarter end reporting date.
Looking forward, the market’s bet on lower rates appears to be in jeopardy as the Consumer Price Index came in hotter than expected, retail sales continue to be strong, and GDP growth exceeds expectations. Analysts are forecasting an S&P 500 year-over-year earnings growth rate of 4% in the first quarter but Factset points out actual earnings growth has exceeded estimates in 37 of the past 40 quarters. All this points to a tug-of-war between positive operating performance by corporate America and the discount rate investors will apply to those earnings in an uncertain and possibly higher than expected inflationary environment.
US Asset Classes: Valuation vs History
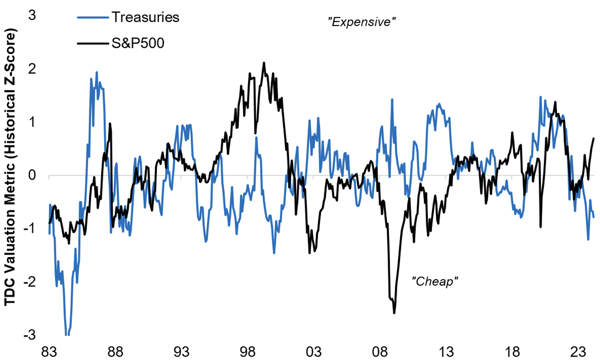
Source: Topdown Charts, LSEG | As of December 31, 2023
Fixed Income: Bond markets rebounded nicely in March with the Bloomberg US Corporate Investment Grade Index leading the pack, gaining 1.29%. Closely behind were corporate high yield bonds, up 1.18% and mortgage-backed securities, up 1.06%. Interest sensitive Treasuries lagged, with the US 10-Year gaining 0.67%, and the 5-Year, up 0.48%.
We have shown this chart before given its importance in deciphering what is driving both stock and bond performance in the current cycle:
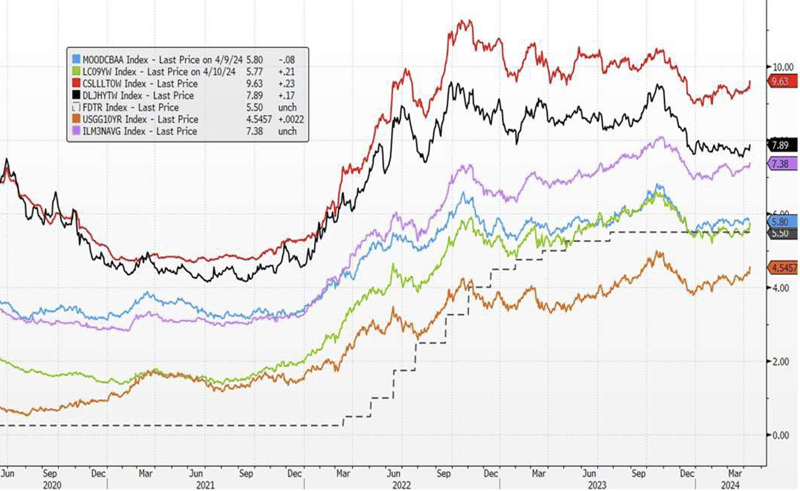
Source: Marketfield Asset Management as of April 10, 2024
The graph depicts yields on a set of bond indices ranging from (credit) risk free 10-Year Treasuries (orange line) to high-risk Credit Suisse Leveraged Loan Index (red line). As can be seen, the yield on the 10-Year Treasury has been drifting higher since 2021 in reaction to the secular forces of deglobalization, pandemic-driven supply issues, the Fed’s associated tightening monetary policy and multi-trillion dollar government deficits. But surprisingly, the credit risk seen in higher risk bonds has not been negatively affected by these major forces and in some cases, their spread to Treasuries (the principal way investors monitor changes in credit risk) has actually dropped. This is indicative of an economy growing moderately with pockets of idiosyncratic stress (commercial real estate, smaller banks) but little indication a recession is imminent.
Federal Reserve and Monetary Policy: Investor euphoria at the close of the quarter soon evaporated in early April when CPI numbers came in higher than anticipated. The Fed now finds itself in a box. It is adamant it won’t make the mistake of easing too soon before inflation is brought under control, but it also doesn’t want to commit another major error and fail to ease before its policy of higher rates causes a major recession.
The market itself – through the two-year Treasury note and credit spreads – is telling the Fed and investors the economy remains relatively healthy and a rate cut should be put off for now. While the economy is registering positive growth in aggregate, the Fed is keenly aware this expansion has not treated everyone equally well. Small businesses, which are much more sensitive to the cost of borrowing than large corporations, are struggling. NFIB small business optimism in March recently declined to its lowest level since December 2012, marking its 27th consecutive month below the survey’s 50-year average. Hiring plans have followed the same trajectory and are at their lowest point since March 2020 when the pandemic hit.
Managed Income Strategy
Manager Commentary: The month of March saw most forms of fixed income on the rise, as yields took a brief pause from the upward trend. The 10-Year Treasury rate moved down slightly from 4.25% to 4.20% at month end, providing some relief for duration-sensitive fixed income assets. U.S. High Yield turned in its best month of the year, buoyed by general market stability, lower volatility, and strength in the equity markets, which continued to produce new all-time highs.
While the upward trajectory in yields paused in March, broader economic data continues to point to an economy running “hotter” than expected. February’s CPI reading, at +3.2% year-over-year, landed slightly higher than economists’ forecasts for the second consecutive month. Nonfarm payrolls also exceeded expectations for the month. These data points, in our view, point to further headwinds for the Federal Reserve to lower rates in the short term. We continue to be wary of a possible “reflation” trade in the short term, which would continue to place pressure on yields. However, this regime is often favorable to U.S. High Yield and floating rate fixed income.
The Managed Income Strategy remains Risk-On as U.S. High Yield continues to show positive relative strength. For now, trends continue to be stable.
Dynamic Growth Strategy
Manager Commentary: The major equity indices continued to forge ahead in March, although there was a notable shift to the return attribution. As we mentioned last month, mega cap stocks, led by the so-called “Magnificent Seven,” began to lose steam compared to the broader market. In February, only four of these stocks outperformed the S&P. In March, only two—NVIDIA and Google—were able to beat the S&P.
We also note the shift in large growth versus other segments of the market. During March, small caps and value sectors outperformed the Nasdaq, and inflation-friendly sectors, such as energy and financials, also outperformed. While yields did not rise during the month, this shift has our attention. We will continue to monitor this recent trend, as it could be a harbinger of stickier inflation, which would continue the relative weakness of growth stocks in the short term.
For now, the Dynamic Growth Strategy remains fully in a Risk-On stance and has not altered its positioning during the month; however, as noted, we will be monitoring the shift in trend away from growth as we move into the second quarter.
Active Advantage Strategy
Manager Commentary: During March, the Active Advantage Strategy remained in a full Risk-On state, with a balanced position between fixed income and equities. As we have mentioned previously, the portfolio management team has positioned the fixed income position inside Active Advantage in an attempt to be insulated against rising rates, with the fixed income book largely consisting of U.S. High Yield and senior loans. During the month, both the fixed income and equity positions reported positive returns.
As noted above, a possible “reflation” trade is currently underway, with gold and other commodities, such as oil, on the rise. Should this continue to be the trend, we expect Active Advantage to remain positioned in a duration-averse manner. On the equity side, we remain positioned broadly across all sectors; however, furthered intensity in this trend could result in portfolio tilts away from growth.
Defender Strategy
Manager Commentary: The first quarter of 2024 saw low volatility in the markets and a positive outcome for equities. Stocks rose for the 5th consecutive month with the S&P 500 Index rising 3.10% in March and finishing the 1st quarter of 2024 up 10.16%. Mid and Small Caps outperformed during March, indicating the broadening out of market returns outside of the mega cap tech stocks that have been driving the markets recently. All eyes have been on The Federal Reserve as they held interest rates steady with a bias to begin lowering the Fed Funds rate later in the year.
The S&P 500, Japan, Europe, Small Caps, and the options overlay were all positive attributes to the Defender strategy for the month of March with the Nasdaq 100 being mostly flat and high yield being a detractor to performance. There is still strong positive momentum in the model across 11 out of the 12 asset classes that are scored heading into April. The Q1 earnings season will start mid-month and will be the next signal to investors as to whether increased stock valuations are supported by corporate earnings growth.
Click below to subscribe to our Insights!
Receive email notifications when new articles are published

Disclaimers:
Investing involves risk, including loss of principal. Past performance does not guarantee future results. There is no guarantee any investment strategy will generate a profit or prevent a loss.
This is for informational purposes only and is not a recommendation nor solicitation to buy, sell or invest in any investment product or strategy. Our materials may contain information deemed to be correct and appropriate at a given time but may not reflect our current views or opinions due to changing market conditions. No information provided should be viewed as or used as a substitute for individualized investment advice. An investor should consider the investment objectives, risks, charges, and expenses of the investment and the strategy carefully before investing.
Kensington Asset Management, LLC (“KAM”) relies on third party sources for some of its information that we believe is reliable. However, we make no representation, warranty, endorse or affirm as to its accuracy or completeness. The information provided is current as of the date of publication and may be subject to change. We are not responsible for updating this information to reflect any subsequent developments or events.
Any indices and other financial benchmarks shown are provided for illustrative purposes only, are unmanaged, reflect reinvestment of income and dividends and do not reflect the impact of advisory fees. Investors cannot invest directly in an index. Comparisons to indexes have limitations because indexes have volatility and other material characteristics that may differ from a particular strategy such as the types of securities being substantially different.
Certain information contained herein constitutes “forward-looking statements,” which can be identified using forward-looking terminology such as “may,” “will,” “should,” “expect,” “anticipate,” “project,” “estimate,” “intend,” “continue,” or “believe,” or the negatives thereof or other variations thereon or comparable terminology. Due to various risks and uncertainties, actual events, results, or actual performance may differ materially from those reflected or contemplated in such forward-looking statements. Nothing contained herein may be relied upon as a guarantee, promise, assurance, or a representation as to the future.
Advisory services offered through Kensington Asset Management, LLC, Barton Oaks Plaza, Bldg II, 901 S Mopac Expy – Ste 225, Austin, TX 78746.
Managed Income Strategy
Risks specific to the Managed Income Strategy include Management Risk, High-Yield Risk, Fixed-Income Security Risk, Foreign Investment Risk, Loans Risk, Market Risk, Underlying Funds Risk, Non-Diversification Risk, Turnover Risk, U.S. Government Securities Risk, LIBOR Risk, Models and Data Risk.
Dynamic Growth Strategy
Risks specific to the Dynamic Growth Strategy include Management Risk, Equity Securities Risk, Market Risk, Underlying Funds Risk, Non- Diversification Risk, Small and Mid-Capitalization Companies Risk, Turnover Risk, U.S. Government Securities Risk, Models and Data Risk.
Active Advantage Strategy
Risks specific to the Active Advantage Strategy include Management Risk, Equity Securities Risk, High-Yield Risk, Fixed-Income Security Risk, Foreign Investment Risk, Loans Risk, Market Risk, Underlying Funds Risk, Limited History of Operations Risk, Non-Diversification Risk, Small and Mid-Capitalization Companies Risk, Turnover Risk, U.S. Government Securities Risk, LIBOR Risk, Models and Data Risk.
Defender Strategy
Risks specific to the Defender Strategy are detailed in the prospectus and include general market risk, credit risk, interest rate risk, management risk, equity securities risk, fixed-income securities risk, high-yield bond risk, foreign investment risk, emerging markets risk, real estate and REITs risk, commodities risk, currency risk, subsidiary risk, market risk, underlying funds risk, derivatives risk, limited history of operations risk, turnover risk, models and data risk, momentum risk or risk of the portfolio not performing as expected.
Definition:
Bloomberg US Aggregate Bond Index: An unmanaged index comprised of US Investment grade fixed rate bond market securities, including government agency, corporate and mortgage-backed securities. Investors cannot invest directly in an index. It is also known as US Aggregate Bond Index.
Bloomberg US Corporate Investment Grade Bond Index: An unmanaged index comprised of US investment grade fixed rate, taxable corporate bond market.
Euro Stoxx 50 Index: A market capitalization-weighted stock index that represents the 50 largest blue-chip European companies operating within the eurozone nations
MSCI EAFE Index: An international equities market index that consists of large and mid-cap stocks across developed markets in Europe, Australasia, and Far East Asia. Excludes US and Canadian stocks.
NASDAQ 100: A market index that comprises of the 100 largest, most actively traded companies listed on the Nasdaq stock exchange.
S&P 500: A capitalization weighted index of 500 stocks representing all major domestic industry groups. The S&P 500 TR Index assumes the reinvestment of dividends and capital gains.
Reflation Trade – Trades that reflect anticipated period of economic recovery and raising inflation. It involves positioning investments to benefit from the potential expansionary monetary and fiscal policies implemented by governments and central banks.
Return Attribution - A set of techniques used to identify the sources of the excess return of a portfolio against its benchmark. It is used to identify sources of excess returns from a firm or fund manager’s active investment decisions.
Russell 2000 Index: A market index that consists of 2,000 small-cap US companies that are part of the larger Russell 3000 Index.