

So far, the spectacular recovery of the equity market from the panic low in late March has been overwhelmingly powered by a narrow group of high-profile technology names. In our previous commentary, we speculated that a broadening of the advance to encompass the many stocks that have lagged in price was taking root, but this is not an overnight process.
One benchmark of the broader market is the S&P 500 Equal Weight Index. Unlike the more commonly followed S&P 500 Index (SPX), this index assigns an equal weighting to each of the 500 stocks that compose the index, whereas the SPX weights each stock according to market capitalization. Thus, the Equal Weight Index is more representative of how the broader stock universe is performing.
One can easily see in the chart below how much the broad market has lagged the big-name leaders since the March 2020 lows by comparing the SPX to the Equal Weight Index. Note how the SPX has surpassed its previous all-time high in February by a significant margin, while the Equal Weight Index has yet to do so. In fact, the Equal Weight Index has just managed to close above the interim high made in early June. To be more confident in the sustainability of the current advance and have conviction that a new bull market has begun, the Equal Weight Index will eventually have to follow SPX’s suit and register a new all-time high as well.
S&P 500 Equal Weight Index Performance Since 1990 Compared to the S&P 500 Index
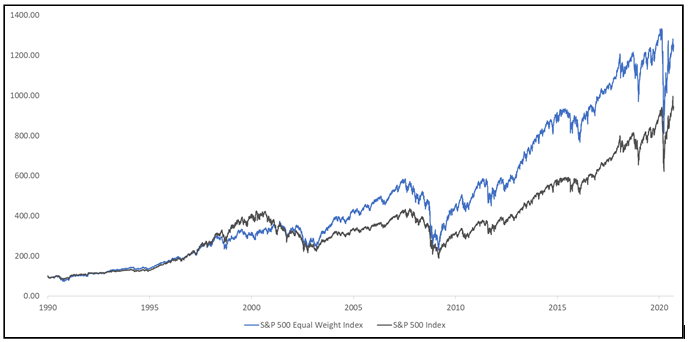
Source: Norgate Data
As I write this, the aforementioned high-profile market leaders (Apple, Facebook, Google, etc.) are beginning to falter as can be seen by a sharp sell-off in the NASDAQ 100 Index. If they can consolidate their gains without too much damage being done to the rest of the market, however, the correction could set the stage for a more pronounced move to the upside propelled by broader indices like the S&P 500 Equal Weight Index.
A reason for believing this will occur is an indicator reading from our Managed Income high-yield bond model. The KA HY Daily Strength Meter measures the collective strength or weakness of key components of the model, thereby giving insight into the overall technical health of the high-yield bond market. On rare occasions, the Strength Meter will give a signal, called a “Momentum Thrust,” indicating we are in the early stages of an upward trend in high-yield bond prices. This is a very bullish sign, of course, because it says the high-yield model indicators are firing on all cylinders.
The next chart shows the history of the Momentum Thrust signal going back to 1994. The signal is triggered whenever the Strength Meter touches or crosses above the upper horizontal green line. As shown below on the daily chart of the ICEBMAL US High Yield Master II Index, in every instance the signal has triggered, the high yield market subsequently experienced an extended period of strength. A recent new signal gives us reason to believe high-yield bond prices will continue to move higher. This bodes well for the economy and also implies higher stock prices lie ahead.
Kensington High Yield Daily Strength Meter Since 1995
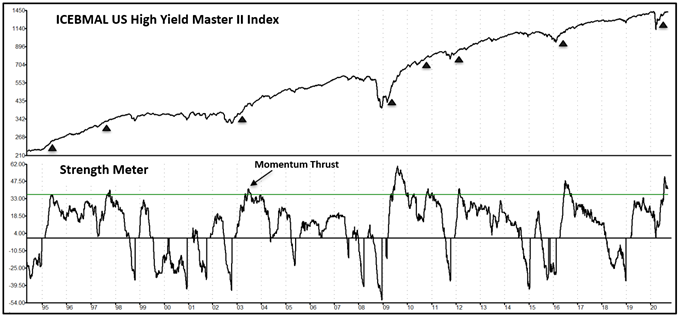
Source:Kensington Asset Management, LLC.
In summary, we see no reason to change our bullish Managed Income portfolio allocations. The severe market decline in March of 2020 was certainly challenging, and the ongoing disruption to normal economic activity from Covid 19 restrictions continues to cloud investor expectations, but our indicators give us reason for cautious optimism with the expectation we will see additional positive performance over the next few months.
Best regards,
Bruce P. DeLaurentis
Kensington Asset Management, LLC.