

Market Insights is a piece in which Kensington’s Portfolio Management team will share interesting and thought-provoking charts that we believe provide insight into markets and the current investment landscape.
This week has been a lesson in how quickly markets can shift. After over 100 days without a 2% correction day for the S&P 500 (SPX) – a streak that has only occurred seven times since 1953 – over the last week, the SPX suffered a drawdown of 3.6% from its closing high, marking the first 3%+ pullback in 5 months. The recent move down has primarily been a byproduct of re-emerging inflationary concerns and escalating geopolitical uncertainty, but it may also just be a healthy breather for a market that has been running hard. In reality, the last five months of smooth sailing have been a bit of an anomaly.
Since 1953, there have been 455 declines of 3% or more on a closing basis. That works out to about one 3% decline every two months. In other words, the fact that we hadn’t had a pullback of 3% in over five months was more unusual than the fact that the S&P 500 is now down over 3% from its high. Since 1953, there have been just ten instances where the S&P 500 went unscathed by a 3% decline for a longer duration than the recently concluded streak.
Though past performance is not an indication of future results, we can anticipate more days like last Friday and Monday, which saw SPX fall 1.5% and 1.2%, respectively. Those drops marked the first back-to-back >1% declines since last October and were only the 5th and 6th 1%+ drops this year. Dating back to 1928 (chart below), SPX has averaged over 29 large down days per year.
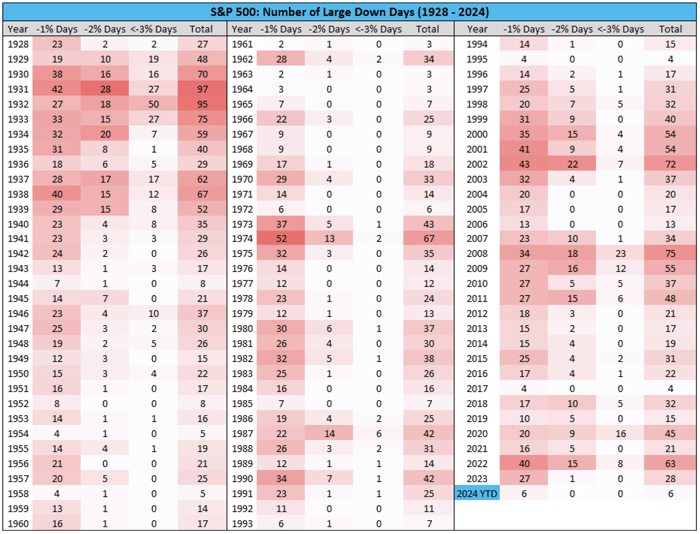
Source: Charlie Bilello, Creative Planning as of April 15, 2024
Keep in mind that the 6 “large down days” this year have all been under 2% declines, so not particularly “large” by historical standards. In fact, 23 of the past 44 years saw the S&P 500 correct 10% or more at some point during the year, a far cry from 2024 so far. Encouragingly, even a 10%+ drawdown in markets is not necessarily an indication of where markets will end up. In 13 of the 23 10%+ drop years over the last 44 years, 13 of those years finished higher, up 17.5% on average (chart below).
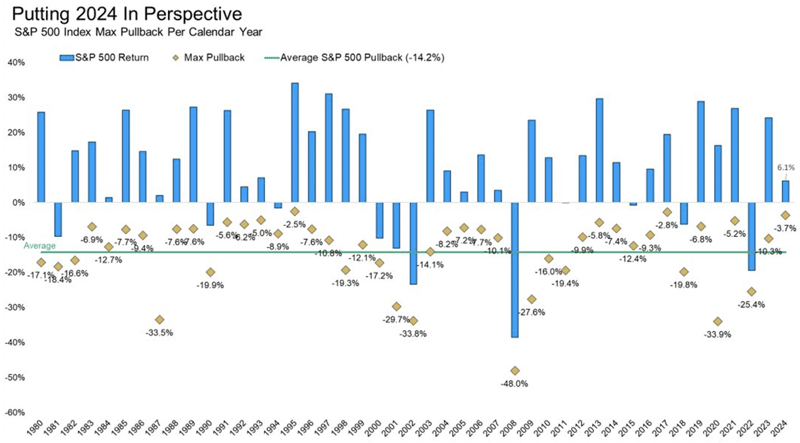
Source: Carson Wealth as of April 16, 2024
The recent move down also broke an important technical level for SPX, closing below its 50-day moving average for the first time in 110 days, the longest such streak since 2011 and the 10th longest streak since 1950. This too, is not necessarily a death knell for markets going forward. Looking at when streaks over 100 days ended showed stocks were higher 3 months later 88% of the time and 6 months later 81% of the time (chart below).
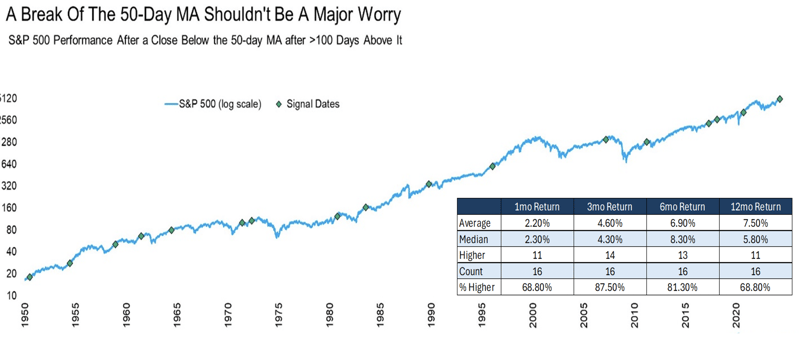
Source: Carson Wealth as of April 16, 2024
Of course, that is not to say the market is not faced with genuine concerns. While the market tends to shrug off geopolitical risks, sticky (or even rising) inflation can present real challenges for future gains. This week, Fed Chairman Powell acknowledged that inflation could be a concern again and that rates may need to remain higher for longer (again). Given continued economic strength, it’s difficult to envision the Fed feels a tremendous need to cut rates anytime soon, and bond markets seem to agree. The 10-year treasury yield has been rising of late, reaching its highest level since November 2023, a reflection of the “higher for longer” narrative taking hold again after markets euphorically priced in more than 6 rate cuts for 2024 as we entered the new year.
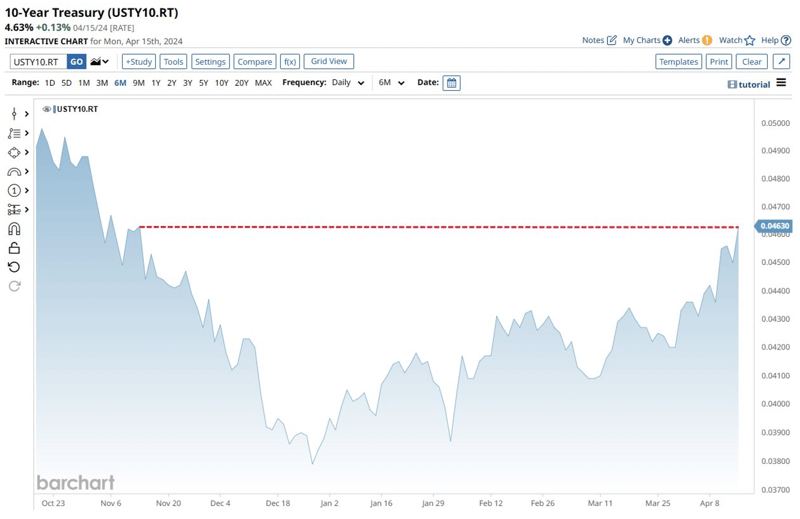
Source: Barchart as of April 15, 2024
Without the tailwind of expected rate cuts, and with the S&P 500 trading at a 20.5x forward P/E ratio, the US stock market doesn’t have much margin for error, which means that a sudden negative news event can cause a quick de-risking, something we’ve seen over the past several days. As we enter Q1 earnings season, we remain in that phase of the bull market in which P/E-multiple expansion should give way to earnings growth. Following a 40% P/E-expansion from 15x to 21x, we are overdue for a changing of the guard. Currently, the expected growth rate is +4% for Q1 earnings, and if history is any guide, that has the potential to increase even higher. The Q4 2023 growth estimate started at +1% and ended at +8%.
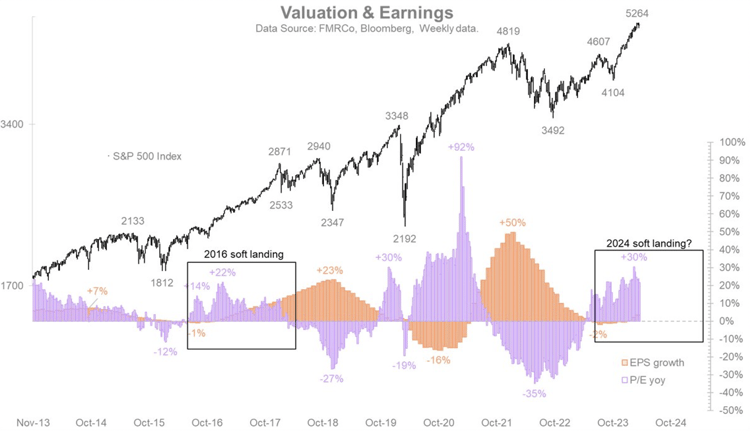
Source: Fidelity Investments as of April 7, 2024
If earnings can surprise to the upside, concerns over “higher for longer” may get pushed down the line in terms of investor worry. However, if earnings disappoint, further weakness in equity markets seems likely as P/E-multiple expansion fueled by AI speculation may have carried the market as far as it can go. Remaining nimble is always important for investors, but a tactical approach may provide necessary flexibility in the weeks and months to come.
Click below to subscribe to our Insights!
Receive email notifications when new articles are published

Disclaimer
Investing involves risk, including loss of principal. Past performance does not guarantee future results. There is no guarantee any investment strategy will generate a profit or prevent a loss.
This is for informational purposes only and is not a recommendation nor solicitation to buy, sell or invest in any investment product or strategy. Our materials may contain information deemed to be correct and appropriate at a given time but may not reflect our current views or opinions due to changing market conditions. No information provided should be viewed as or used as a substitute for individualized investment advice. An investor should consider the investment objectives, risks, charges, and expenses of the investment and the strategy carefully before investing.
Kensington Asset Management, LLC (“KAM”) relies on third party sources for some of its information that we believe is reliable. However, we make no representation, warranty, endorse or affirm as to its accuracy or completeness. The information provided is current as of the date of publication and may be subject to change. We are not responsible for updating this information to reflect any subsequent developments or events.
Certain information contained herein constitutes “forward-looking statements,” which can be identified using forward-looking terminology such as “may,” “will,” “should,” “expect,” “anticipate,” “project,” “estimate,” “intend,” “continue,” or “believe,” or the negatives thereof or other variations thereon or comparable terminology. Due to various risks and uncertainties, actual events, results, or actual performance may differ materially from those reflected or contemplated in such forward-looking statements. Nothing contained herein may be relied upon as a guarantee, promise, assurance, or a representation as to the future.
Advisory services offered through Kensington Asset Management, LLC, Barton Oaks Plaza, Bldg II, 901 S Mopac Expy – Ste 225, Austin, TX 78746.