

Market Insights is a piece in which Kensington’s Portfolio Management team will share interesting and thought-provoking charts that we believe provide insight into markets and the current investment landscape.
Last week concluded a historic first quarter for the S&P 500 (SPX), which closed at a fresh all-time high and marked the second consecutive quarter of +10% gains, a feat seen only seven other times since 1950. March also marked the fifth straight positive month for the index, gaining a remarkable 26% since last November. Perhaps the most significant aspect of this recent rally, however, is the fact that year-to-date, the S&P 500's maximum drawdown is just -1.7%, with the index going over 100 days straight without a 2% correction, a phenomenon witnessed only seven times since at least 1950.
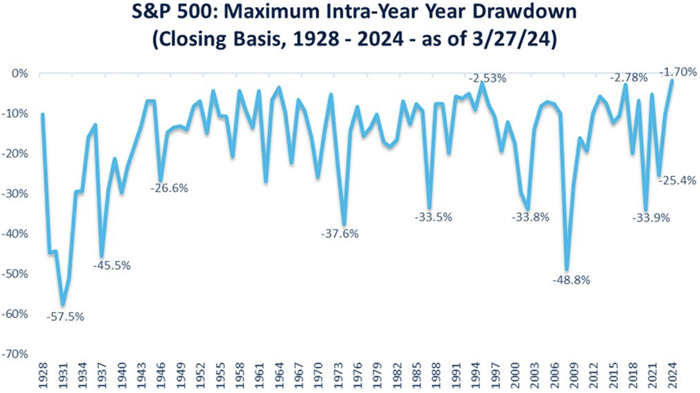
Source: Charlie Bilello, Creative Planning, as of March 27, 2024
Bonds Slump
Bonds, on the other hand, faced a different trajectory in the first quarter. While fixed income similarly rallied through November and December, Q1 proved to be less favorable. As market expectations for Fed rate cuts dwindled from as high as seven cuts in 2024 to under three at the end of March (chart below), most bonds, particularly the more duration sensitive categories, experienced broad losses as rates rose across the yield curve.
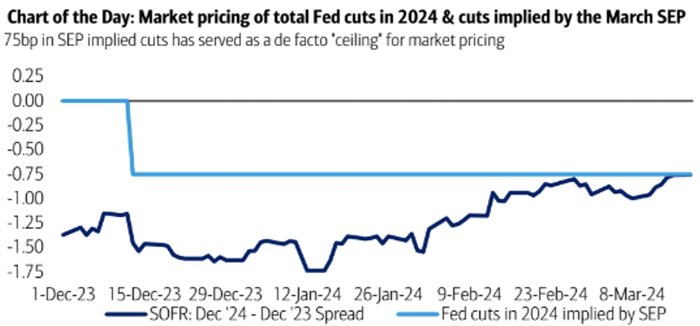
Source: BofA Global Research as of March 8, 2024
Summary of Economic Projections (“SEP”) from the Federal Open Market Committee (FOMC)
Secured Overnight Financing Rate (SOFR) is a broad measure of the cost of borrowing cash overnight collateralized by Treasury securities.
The first quarter slump in bond prices is not surprising given the repricing of rate-cut expectations, but the equity markets ability to brush off this shift has resulted in an eye-catching divergence from recent historical trend (chart below), in which stocks had been closely tracking the inverse of the presumed policy rate.
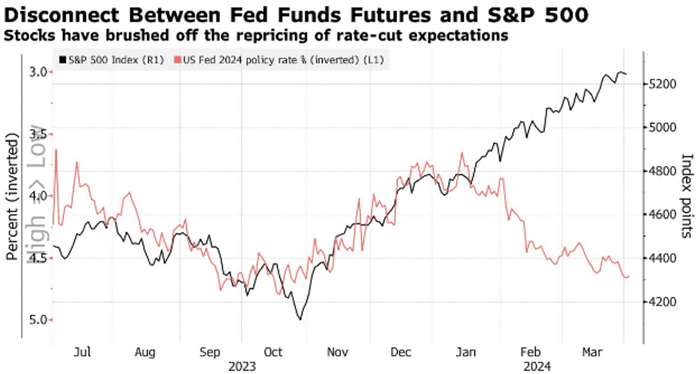
Source: Bloomberg as of April 1, 2024
With consensus inflation expectations now on the rise (chart below) and a growing belief that the Fed may not make any rate cuts in 2024, investors may start growing wary about the sustainability of the current bull run for stocks.
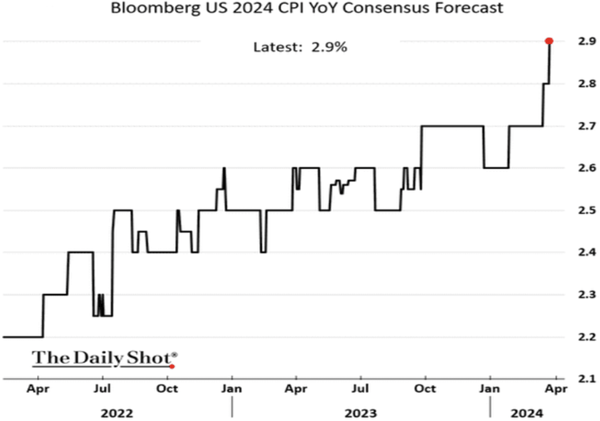
Source: Bloomberg as of March 28, 2024
Even without considering inflation and rate expectations, a robust five-month rally is bound to attract doubters about the market’s ability to sustain its upward trajectory. However, history has shown that such strength often leads to further gains. Dating back to 1950, when the S&P 500 achieved a 10% or more increase in the first quarter of the year, it finished the year higher in 10 out of 11 previous occurrences, with a median gain of 8.2% in the final nine calendar months (chart below).
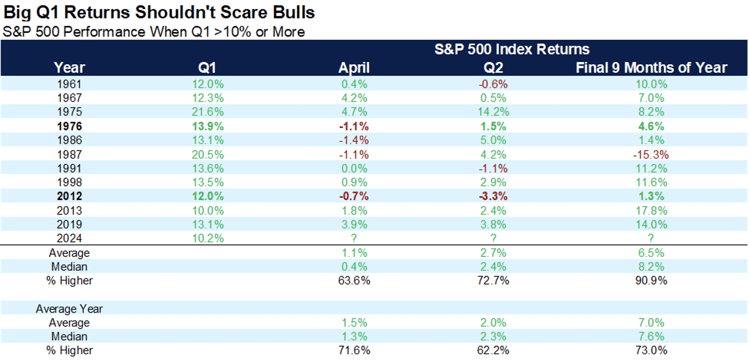
Source: Carson Investment Research, FactSet 03/29/2024
Moreover, when the S&P 500 generated a 10% increase in back-to-back quarters (admittedly a rare occurrence), the index has been up a year later in 6 out of 7 previous instances dating back to 1950, with an average gain of 12.3% (chart below).
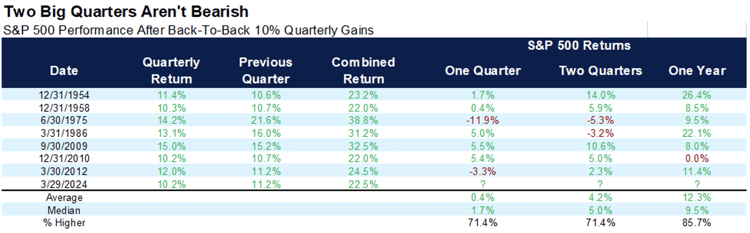
Source: Carson Investment Research, FactSet 03/29/2024
The recent performance of both the S&P 500 and bond markets has left investors pondering their next moves. While equities have seen a notable rally, bonds have faced headwinds due to shifting rate expectations. The divergence between these asset classes is notable, particularly as the possibility of fewer rate cuts in 2024 continues to grow. Despite historical data suggesting that strong market performance often leads to further gains, a spike in volatility may be on the horizon. Going forward, a tactical investment approach, one that remains nimble in the face of evolving market dynamics, may be prudent in navigating the unpredictable landscape ahead.
Click below to subscribe to our Insights!
Receive email notifications when new articles are published

Disclaimer
Investing involves risk, including loss of principal. Past performance does not guarantee future results. There is no guarantee any investment strategy will generate a profit or prevent a loss.
This is for informational purposes only and is not a recommendation nor solicitation to buy, sell or invest in any investment product or strategy. Our materials may contain information deemed to be correct and appropriate at a given time but may not reflect our current views or opinions due to changing market conditions. No information provided should be viewed as or used as a substitute for individualized investment advice. An investor should consider the investment objectives, risks, charges, and expenses of the investment and the strategy carefully before investing.
Kensington Asset Management, LLC (“KAM”) relies on third party sources for some of its information that we believe is reliable. However, we make no representation, warranty, endorse or affirm as to its accuracy or completeness. The information provided is current as of the date of publication and may be subject to change. We are not responsible for updating this information to reflect any subsequent developments or events.
Certain information contained herein constitutes “forward-looking statements,” which can be identified using forward-looking terminology such as “may,” “will,” “should,” “expect,” “anticipate,” “project,” “estimate,” “intend,” “continue,” or “believe,” or the negatives thereof or other variations thereon or comparable terminology. Due to various risks and uncertainties, actual events, results, or actual performance may differ materially from those reflected or contemplated in such forward-looking statements. Nothing contained herein may be relied upon as a guarantee, promise, assurance, or a representation as to the future.
Advisory services offered through Kensington Asset Management, LLC, Barton Oaks Plaza, Bldg II, 901 S Mopac Expy – Ste 225, Austin, TX 78746.