

Market Insights is a piece in which Kensington’s Portfolio Management team will share interesting and thought-provoking charts that we believe provide insight into markets and the current investment landscape.
The S&P 500 reached a new all-time high last week after a feverish run that began in late October. The index has recorded gains in 12 of the last 13 weeks (see chart below), an occurrence that has not happened since 1985. Despite relatively weak Q4 2023 earnings announcements thus far (approximately 25% of S&P 500 companies having reported), earnings have contracted 1.4% year over year compared to +1.5% consensus estimates, the US equity market has surged ahead on encouraging inflation data, strong economic growth, and the continued expectation for rate cuts by the Federal Reserve in 2024.
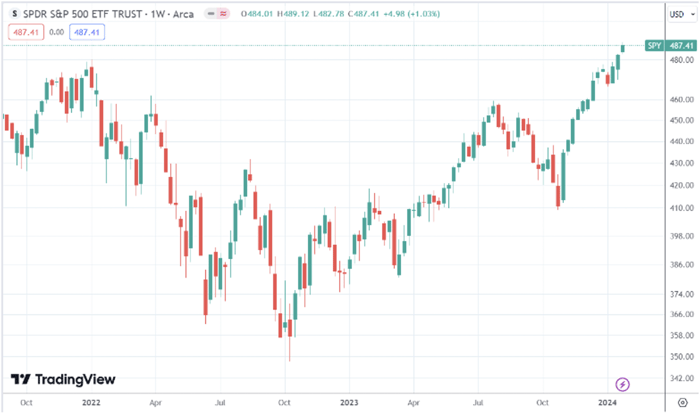
Source: TradingView, as of January 26, 2024
In the wake of this historical three-month run, there is growing concern that equities may be overextended and due for a pullback. As noted in the chart below, the S&P 500 is statistically expensive relative to the historical average across 19 of 20 different valuation metrics, including the often-referenced Forward Consensus Price/Earnings (P/E) ratio, which as of January 26, 2024, sat at 20.0x compared to an average of 15.8x dating back to 1986.
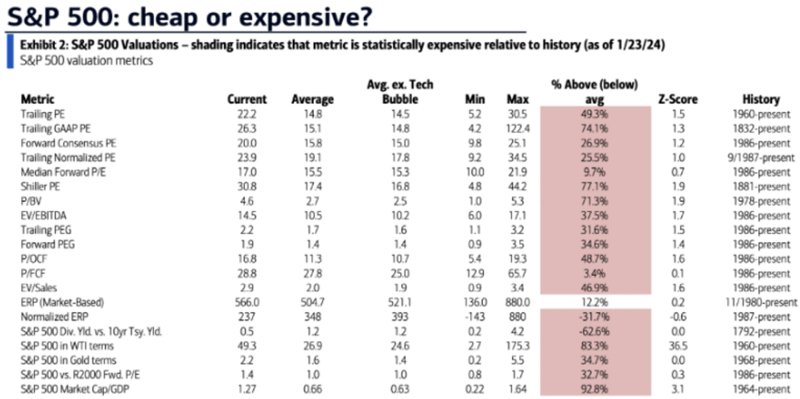
Source: BofA Global Research, as of January 23, 2024
It's reasonable to believe the market is due for a pullback, given its 19%+ rise over the last three months. Historically, however, such a strong run-up has been quite bullish when evaluating similar past instances. According to Ryan Detrick of Carson Group (see chart below), there have been 18 other times in which the S&P 500 rose 19% or greater in a three-month period, and in 15 of those 18 instances the market was up a year later, with an average return of 13.5% and a median return of 16.1%.
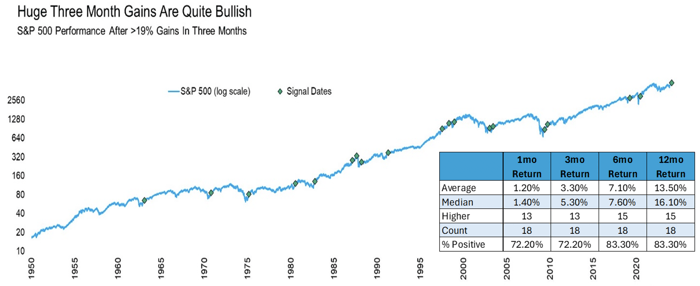
Source: Carson Group, Ryan Detrick as of January 30, 2024
With the forward P/E ratio having expanded so quickly, from a low of 15.3x in October 2022 to 20.0x today, corporate earnings growth in 2024 will play a considerable role in determining if the market can continue to rise. Almost all of last year's equity gains came from P/E expansion (see chart below), as earnings were essentially flat for the year. History shows that we have reached that part of the cycle where the baton must get passed from multiple expansion to earnings growth if we are to expect further gains in 2024.
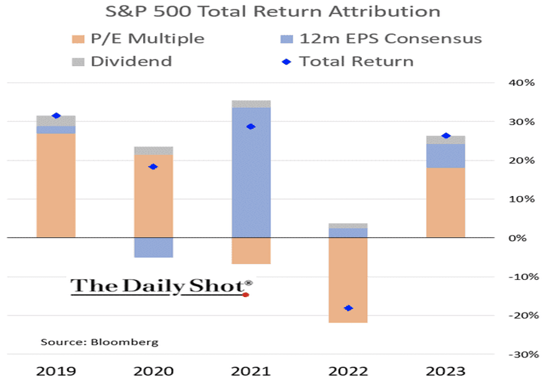
Source: Daily Shot, Bloomberg, as of December 31, 2023
Thankfully, we may be on our way. While Q4 2023 earnings have slightly disappointed so far, consensus forecasts for 2024 sit at 11% growth for the year, according to Factset. If the market is able to achieve such growth, it may relieve some pressure on prevailing multiples, bringing them more in line with historical averages and/or providing runway for further market gains.
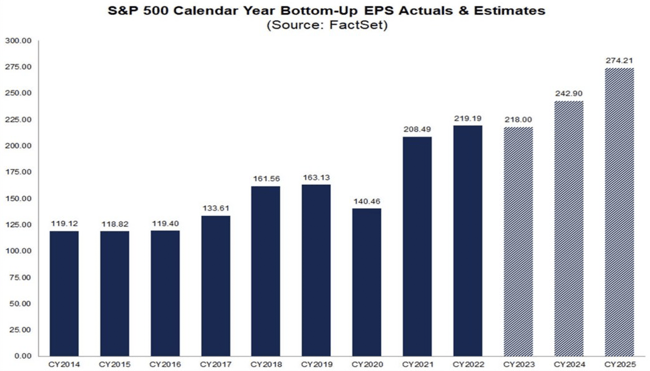
Source: FactSet, as of January 26, 2024
With 5 of the 7 members of the so-called "Magnificent 7" reporting earnings this week, it's important to revisit the role these stocks played in last year's market. At year-end 2023, these 7 stocks accounted for almost 30% of the S&P 500 (see chart below) market cap and were responsible for nearly 52% of the index gains in 2023, a percentage that would have been much higher had we not seen broadening participation through November and December.
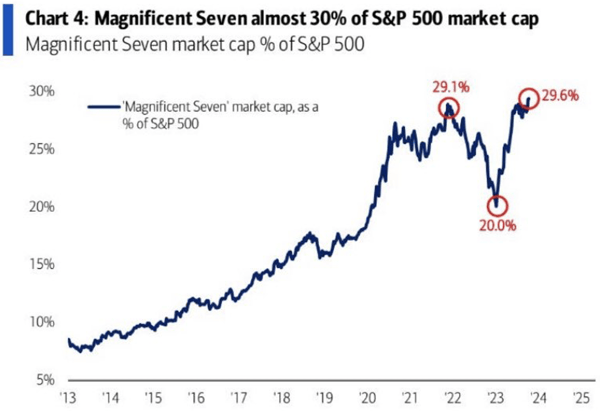
Source: BofA Global Research as of October 14, 2023
For better or worse, the success of these companies will continue to play a very important role in how equity markets perform in 2024, much the same way they did in 2023. That may not be such a bad thing in the short term, as while Q4 earnings revisions have been up 4% for the Magnificent 7, they have been down -15% for the other 493 companies in the index (see chart below).
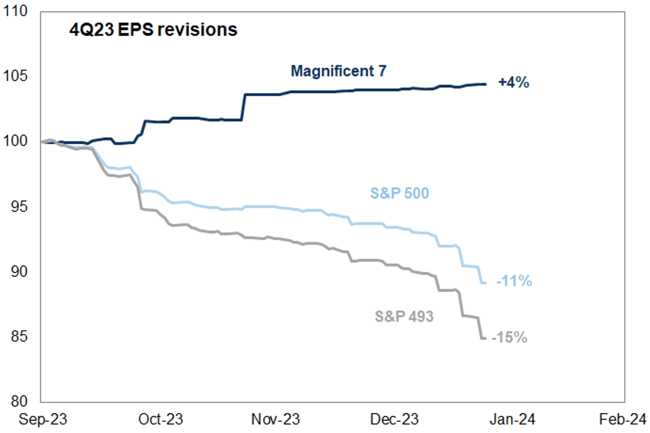
Source: Jon Wolfenbarger, Bull & Bear Profits, January 29, 2024
This concentrated influence by a few stocks can be beneficial for equity markets in the short term, as it was in 2023, but as JPMorgan pointed out this week, the dominance of these stocks "is increasingly drawing similarities with the dot-com bubble, raising the risk of a selloff," noting that "extremely concentrated markets present a clear and present risk to equity markets in 2024." Optimism about artificial intelligence has certainly played a key role in the advancement of these Mega Caps and may continue to do so, but maintaining a tactical approach to investing may prove beneficial since there will come a time when these stocks cannot sustain their recent trajectory.
Click below to subscribe to our Insights!
Receive email notifications when new articles are published

Forward-looking statements are based on management’s then current views and assumptions and, as a result, are subject to certain risks and uncertainties that could cause actual results to differ materially from those projected. This market insight is for informational purposes only and should not be construed as a solicitation to buy or sell, or to invest in any investment product or strategy. Investing involves risk including loss of principal.
Investing involves risk, including loss of principal. Past performance does not guarantee future results. There is no guarantee any investment strategy will generate a profit or prevent a loss.
This is for informational purposes only and is not a recommendation nor solicitation to buy, sell or invest in any investment product or strategy. Our materials may contain information deemed to be correct and appropriate at a given time but may not reflect our current views or opinions due to changing market conditions. No information provided should be viewed as or used as a substitute for individualized investment advice. An investor should consider the investment objectives, risks, charges, and expenses of the investment and the strategy carefully before investing.
Kensington Asset Management, LLC (“KAM”) relies on third party sources for some of its information that we believe is reliable. However, we make no representation, warranty, endorse or affirm as to its accuracy or completeness. The information provided is current as of the date of publication and may be subject to change. We are not responsible for updating this information to reflect any subsequent developments or events.
Any indices and other financial benchmarks shown are provided for illustrative purposes only, are unmanaged, reflect reinvestment of income and dividends and do not reflect the impact of advisory fees. Investors cannot invest directly in an index. Comparisons to indexes have limitations because indexes have volatility and other material characteristics that may differ from a particular strategy such as the types of securities being substantially different.
Certain information contained herein constitutes “forward-looking statements,” which can be identified using forward-looking terminology such as “may,” “will,” “should,” “expect,” “anticipate,” “project,” “estimate,” “intend,” “continue,” or “believe,” or the negatives thereof or other variations thereon or comparable terminology. Due to various risks and uncertainties, actual events, results, or actual performance may differ materially from those reflected or contemplated in such forward-looking statements. Nothing contained herein may be relied upon as a guarantee, promise, assurance, or a representation as to the future.
Advisory services offered through Kensington Asset Management, LLC, Barton Oaks Plaza, Bldg II, 901 S Mopac Expy – Ste 225, Austin, TX 78746.
Definitions
S&P 500: A capitalization weighted index of 500 stocks representing all major domestic industry groups. The S&P 500 TR Index assumes the reinvestment of dividends and capital gains.