

Market Insights is a piece in which Kensington’s Portfolio Management team will share interesting and thought-provoking charts that we believe provide insight into markets and the current investment landscape.
While we are a week removed from Nvidia’s (NVDA) 4th quarter 2023 earnings announcement, the Silicon Valley-based AI chipmaker remains the talk of equity markets, given its recent blowout announcement. Q4 revenues soared above already high expectations to $22 billion — a 270% increase from the previous year. The subsequent rally for the company’s stock pushed NVDA’s overall market cap to over $2 trillion, joining Microsoft (MFST) and Apple (AAPL) as the only US companies to reach that mark.
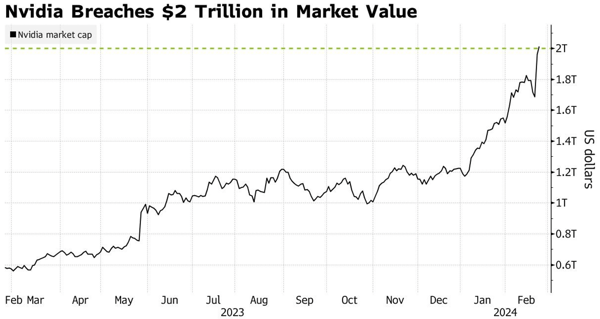
Source: Bloomberg, as of February 23, 2024
Even prior to last week’s earnings report, Nvidia has been on a stock market run that’s virtually unprecedented. Following a more than tripling in 2023, Nvidia shares have jumped nearly 60% already this year, including a gain of $277 billion on February 22, the largest single-day move in US equity market history, eclipsing Meta’s $196 billion market cap gain from just 20 days prior (chart below).
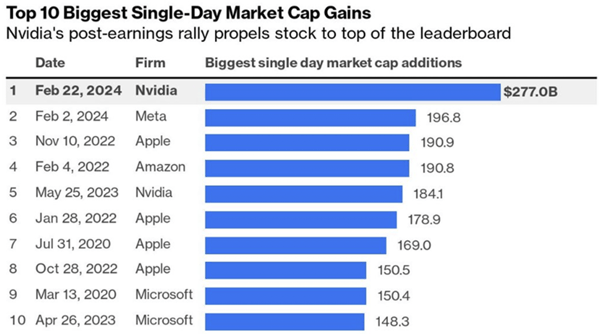
Source: Bloomberg, as of February 24, 2024
Turbocharged by Nvidia’s earnings, the S&P 500 notched another new all-time high last week, its 13th new high this year. Much as was the case in 2023, 2024 market cap gains have been driven by a very select few companies. In fact, just 4 companies have accounted for a whopping 95% of the NASDAQ 100 year-to-date market cap gains. Nvidia, Meta, Microsoft, and Amazon have added a total of $1.5 trillion in market cap in 2024, while the remaining 97 companies in the index have contributed just $75 billion to the index capitalization (chart below).
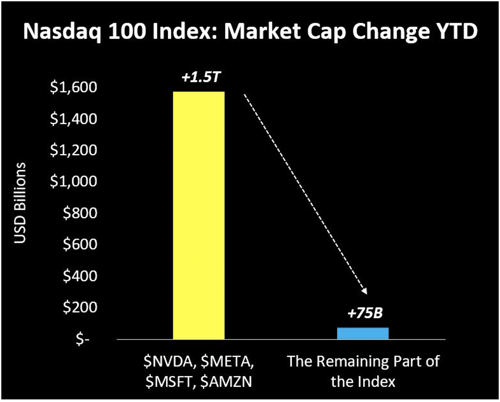
Source: Otavio Costa, Crescat Capital, LLC as of February 27, 2024
That’s not to say that all other segments of the US equity market are sagging. The stat above is more a reflection of how large those four companies are, as price gains for their stocks have a much more significant impact on overall stock market capitalization. In reality, most segments of the market have been strong as well. Looking at the S&P 500 for the month of February, we see that 5 of 11 sectors (Industrials, Consumer Discretionary, Materials, Healthcare, and Communication Services) are up over 5% month-to-date, with all sectors positive for the period (chart below).
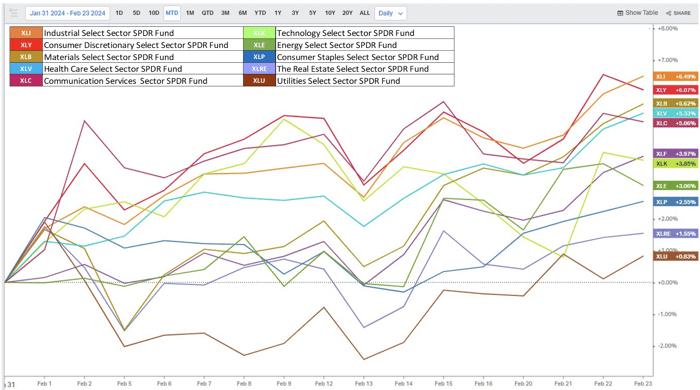
Source: X.com/MikeZaccardi as of February 24, 2024
AI Bubble?
After such a historic run, naturally, the narrative has quickly shifted to wondering if NVDA (and tech stocks in general) are overvalued. Incredibly, at least in the case of NVDA, the answer is surprisingly unclear. For comparison's sake, note that when the market bottomed in October of 2022, NVDA had a market cap of $280 billion and a 12-month forward P/E of 32x. As noted above, last Thursday, NVDA added $277 billion of market cap alone, and yet its P/E ratio sits relatively unchanged at 33X. Currently, NVDA has only the 74th highest forward P/E ratio among the companies in the S&P 500 Index (chart below).
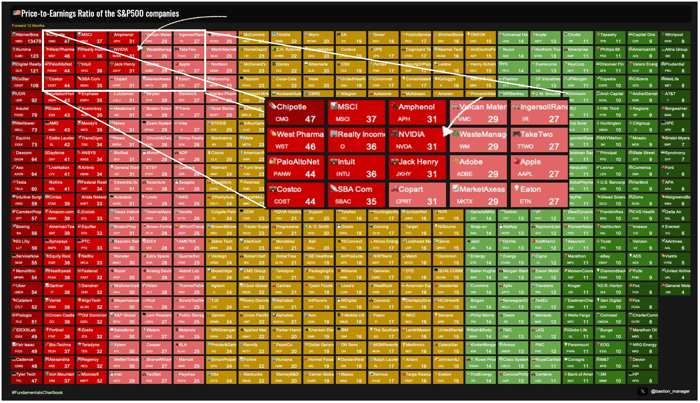
Source: Vlad Bastion, Bastion Research as of February 22, 2024
Broadening our lens to the overall “AI Economy”, of which NVDA is the clear leader, Apollo published a troublesome report that stated, “The current AI bubble is bigger than the 1990s tech bubble.” In their report, they note that the Forward P/E ratio for the top 10 tech stocks right now is approximately 40X. Compared to 2000, at the peak of the Dot-com bubble, the Forward P/E on the top 10 tech stocks was approximately 26x (chart below).
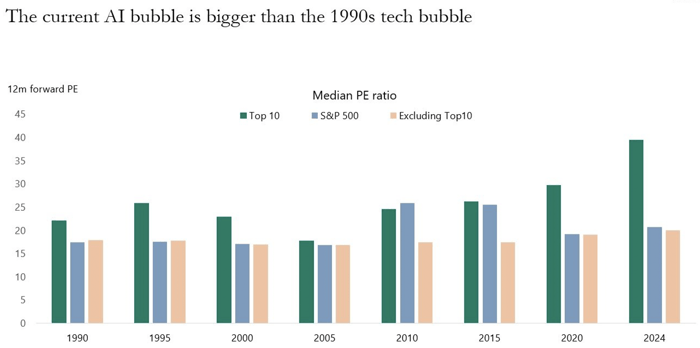
Source: Apollo as of February 25, 2024
While it’s natural to make the comparison to the Dot-com bubble, there are notable differences. Tech stocks at that time were barely profitable (some not at all) and had almost every key metric overlooked and reliant on speculation. Meanwhile, according to their Q4 earnings report, Nvidia operated at an almost absurd margin of +61% (almost 2x of last year), has $25 billion in cash on its books, and did $61 billion in revenue (+126% YoY).
This week Citi’s quantitative team, led by Alex Saunders, issued a report countering Apollo’s position, noting, “The AI bubble is not in trouble, and if anything, earnings performance suggests that it is less of a bubble to begin with." Crucial for Nvidia investors, the report found that if stock performance is up more than 10% on earnings day, "those large-cap stocks with strong performance into earnings continue to perform very well for the next three months."
However, the analysts concede that significant surges akin to Nvidia’s post-earnings performance are relatively uncommon. They identified just nine occurrences, all within the technology sector, predominantly during the bubble periods of the early 2000s. These stocks tended to sustain their momentum, seeing a subsequent increase, on average, up 27% over the following months.
The bubble vs no-bubble debate will ultimately be decided by these companies’ ability to keep meeting the ever-growing earnings expectations of market participants. What is certain is that when the “market” is dependent on just a handful of companies operating results, the probability of large market swings in either direction (read: volatility) increases. Taking a tactical approach going forward may prove beneficial in the months ahead.
Click below to subscribe to our Insights!
Receive email notifications when new articles are published

Disclaimer
Investing involves risk, including loss of principal. Past performance does not guarantee future results. There is no guarantee any investment strategy will generate a profit or prevent a loss.
This is for informational purposes only and is not a recommendation nor solicitation to buy, sell or invest in any investment product or strategy. Our materials may contain information deemed to be correct and appropriate at a given time but may not reflect our current views or opinions due to changing market conditions. No information provided should be viewed as or used as a substitute for individualized investment advice. An investor should consider the investment objectives, risks, charges, and expenses of the investment and the strategy carefully before investing.
Kensington Asset Management, LLC (“KAM”) relies on third party sources for some of its information that we believe is reliable. However, we make no representation, warranty, endorse or affirm as to its accuracy or completeness. The information provided is current as of the date of publication and may be subject to change. We are not responsible for updating this information to reflect any subsequent developments or events.
Certain information contained herein constitutes “forward-looking statements,” which can be identified using forward-looking terminology such as “may,” “will,” “should,” “expect,” “anticipate,” “project,” “estimate,” “intend,” “continue,” or “believe,” or the negatives thereof or other variations thereon or comparable terminology. Due to various risks and uncertainties, actual events, results, or actual performance may differ materially from those reflected or contemplated in such forward-looking statements. Nothing contained herein may be relied upon as a guarantee, promise, assurance, or a representation as to the future.
Advisory services offered through Kensington Asset Management, LLC, Barton Oaks Plaza, Bldg II, 901 S Mopac Expy – Ste 225, Austin, TX 78746.