

Market Insights is a piece in which Kensington’s Portfolio Management team will share interesting and thought-provoking charts that we believe provide insight into markets and the current investment landscape.
Recession Concerns on the Rise
Equities have rallied in recent periods following the Federal Reserve’s decision to hold the target range for the federal funds rate at its 22-year high of 5.25%-5.5% for the second consecutive time after 11 consecutive rate increases. Despite the recent rally, there is growing concern amongst investors that the United States is headed for recession in 2024.
What is a Recession?
The term "recession" is frequently mentioned, but identifying when we have actually entered a recession can be a challenging task. The National Bureau of Economic Research (NBER) defines a recession as "a significant decline in economic activity spread across the economy, lasting more than a few months, and typically visible in real GDP, real income, industrial production, and wholesale-retail sales." A more simplified version of this definition often characterizes recessionary periods as "two consecutive quarters of decline in real GDP."
The most recent measurement of US GDP for Q3 2024 came in at an astonishing +4.9%. This leads to the question, "Why are so many raising alarms about a recession?" One reason is directly linked to the Federal Reserve and its rate decision. As shown in the chart below, dating back to 1985, every recession has followed a peak in the federal funds rate. If the Federal Reserve has indeed concluded the rate hike cycle, historical precedent suggests that a recession may follow.
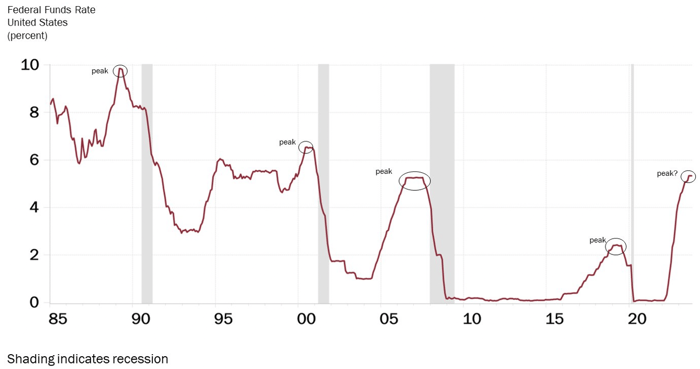
Source: Haver Analytics, Federal Reserve, Rosenberg Research
Yield Curve Un-Inversion
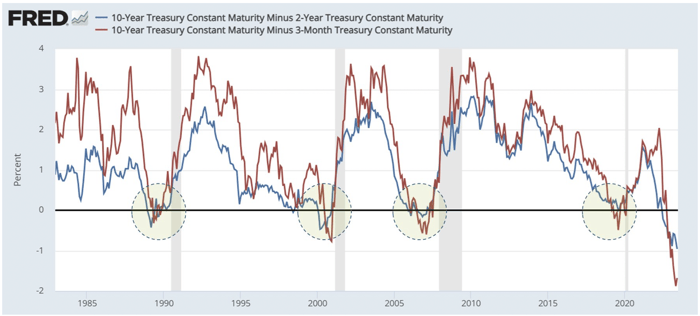
Another warning sign for a recession pertains to the yield curve. It is often mentioned that an inversion of the 2-year Treasury yield vs the 10-year Treasury yield is a recession warning sign, but it is, in fact, the un-inversion of these yields that has more closely aligned with recessions (as depicted in the chart below). The 2Y-10Y spread has been inverted for over a year, but the gap has recently narrowed significantly, closing to as little as 0.13% from a high of 1.08% this past July.
GDP Breakdown
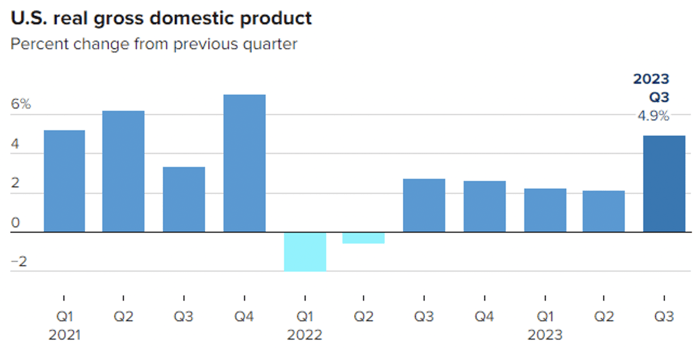
Part of the concern about a recession is directly related to the Q3 GDP report. While the headline number of 4.9% (as shown in the chart below) is quite strong, some of the primary contributors to that number may face significant challenges in the coming quarters, particularly consumer and government spending. US total household debt surged in Q3, increasing by 1.3% to a total level of $17.29 trillion, including a 4.7% rise in credit card debt to $1.08 trillion. Meanwhile, the estimated annualized interest payments on US government debt exceeded $1 trillion at the end of October, a figure that has doubled in the last 19 months and is equivalent to 15.9% of the entire federal budget for fiscal year 2022. These rising debt obligations could significantly impact spending and lead to a substantial drop in GDP in the quarters to come.
Employment
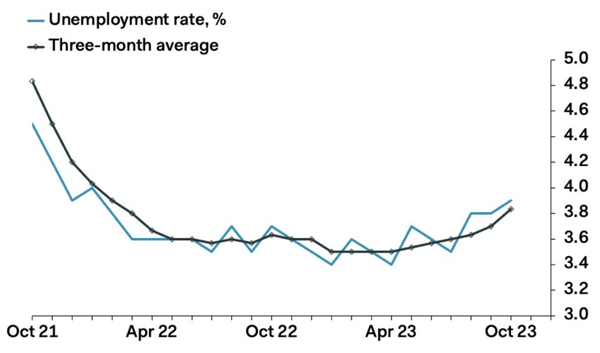
There are other signs pointing to a slowdown as well. The labor market has been remarkably resilient in the past two years, with the unemployment rate remaining below 4% for 21 consecutive months, marking the longest such stretch in over 50 years. However, this measure has been gradually ticking up in recent months. In October, the unemployment rate rose to 3.9%, marking the third consecutive monthly increase from a low of 3.4% in April 2023. With increasing news of hiring freezes and layoff announcements during Q3 earnings reports, we may be in for a significant rise in this measure, which will undoubtedly put further pressure on growth.
Leading Economic Indicators
One measure that takes each of the above metrics into consideration (amongst many other data points) is the Conference Board’s Leading Economic Index, which has contracted 18 months in a row and sits at a level that has historically coincided with recession (chart below).
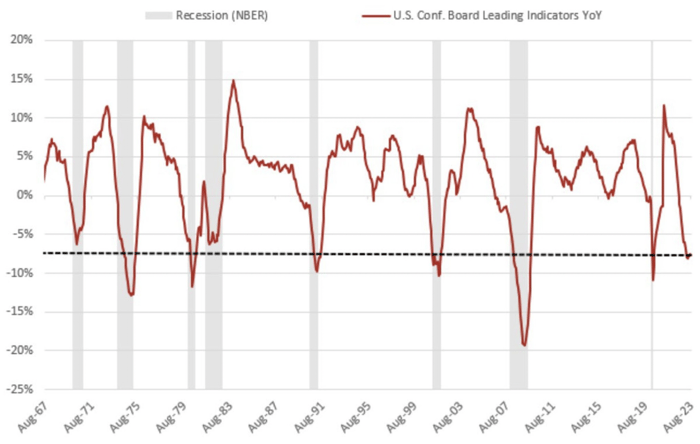
Source: Bloomberg, NBER, christophe-barraud.com
The Economy is Not the Market
If we are indeed faced with a recession, it is essential to remember that a recession is a measure of the economy, not the market. That said, recessions typically result in some level of market pullback as slowing economic growth affects corporate profitability. Since 2000, the S&P 500 has experienced a drawdown of 18.58% during a recession, while the NASDAQ fell 14.48%. However, the S&P 500 has surprisingly risen by an average of 1% over full recession periods since 1945. Nevertheless, averages can be deceiving, as actual performance can vary significantly from one recession to another (chart below).
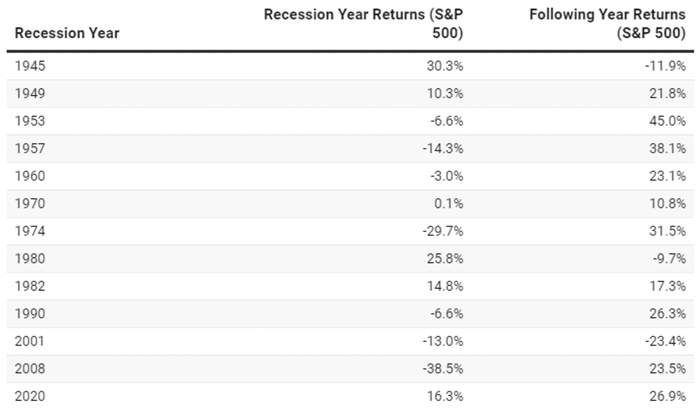
Source: CFRA Research, NBER, S&P Global | Created with Datawrapper
A key takeaway from this is that while market results can differ in a recessionary environment, in all cases it raises the level of risk presented to investors. Drawdowns will occur, but often drawdowns present attractive buying opportunities for more nimble investors. Incorporating a tactical approach into client portfolios may be beneficial in the months to come.
Forward-looking statements are based on management’s then current views and assumptions and, as a result, are subject to certain risks and uncertainties that could cause actual results to differ materially from those projected. This market insight is for informational purposes only and should not be construed as a solicitation to buy or sell, or to invest in any investment product or strategy. Investing involves risk including loss of principal.
Click below to subscribe to our Insights!
Receive email notifications when new articles are published
