


Summary
- Stock-Bond correlation has changed over time. While these correlations have been negative for the last 20 years, they have recently been increasing, similar to what was observed for the 30 years prior to the year 2000.
- The macroeconomic environment affects both common and differing factors in stock and bond valuation fundamentals. Correlations can be either positive or negative depending on which element is dominant.
- When stock-bond correlations are positive, it can lessen the effectiveness and benefits of traditional balanced strategies.
- Incorporating active trend following can be an excellent way to improve portfolio robustness beyond just including commodities and Treasury Inflation Protected Securities (“TIPs”) or other inflation hedges.
A Historical Look at Stock-Bond Correlation
For decades, many traditional balanced portfolios that allocate a static portion of their portfolios to equity and fixed income securities have benefited from the negative correlation between stocks and bonds, particularly when the market experienced large adverse shocks and declining sentiment. During good times, US equities can provide a strong source of growth for portfolios, while government bonds tend to rise during bad times, due to the flight-to-safety effect. This negative correlation worked as a natural hedge for clients’ portfolios, limiting losses and providing for improved risk-adjusted returns. Furthermore, for the last 20 years, government bonds have provided a decent return to investors in addition to their hedging properties, in some sense acting as insurance with a negative premium to the buyer. However, this was not always the case, as the negative correlation between the two asset classes has not always existed. Changes in macroeconomic conditions can affect this dynamic, illustrated in Figure 1 below. For example, from the 1970s up until the mid-1990s, stock-bond correlation was higher when inflation was also generally higher, suggesting a link between the two.
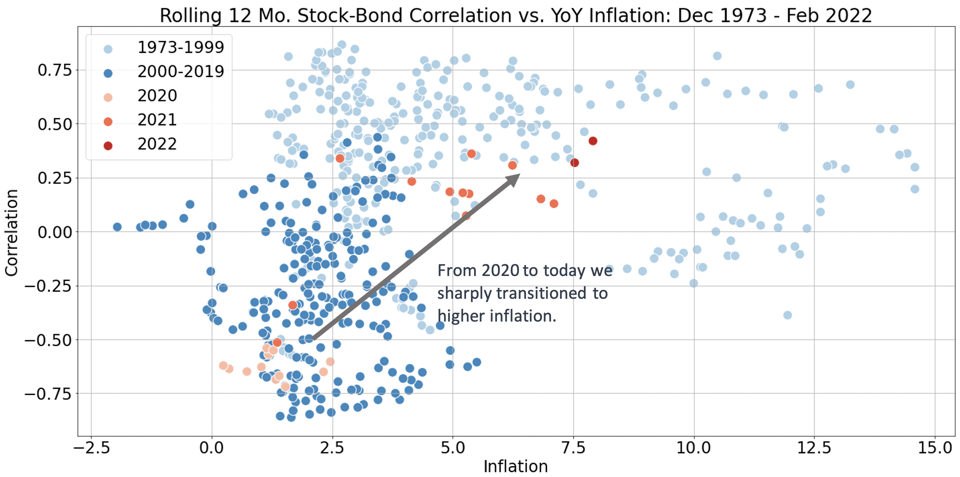
Figure 1. Monthly Stock-Bond Correlation against inflation over time. When inflation runs high, correlations between equities and bonds tend to be higher.
Equities are represented by S&P 500 Index Total Returns. Bonds are represented by the Bloomberg U.S. Government Treasuries Total Return Index.
Data provided from Norgate Data, and Bloomberg Finance L.P. Calculations performed by Kensington Asset Management.
The Fundamental Drivers
For an idea of what factors could be drivers of stock-bond correlation, we start with a fundamental framework. Bond and equity prices represent discounted cash flow streams, and so it is helpful to look at simple models that connect cashflows to price:
where Dt, Ct, gt, and rt are dividends, coupons, expected growth and risk-free rate at time t respectively, and FV is the face value of the bond. ERP is the equity risk premium, or simply the hurdle rate above rt preferred by investors for bearing general equity risk. Similarly, BRP is the bond risk premium, which is the hurdle rate above rt generally preferred by investors for bearing general bond-related risks. With this framework in mind, we can look at common and different components between both equity and bond valuation:
- In the numerators: bond cash flows are certain, whereas stocks have uncertain cash flows tied to expected growth (gt) and dividends (Dt) over a period.
- In the denominators: the discount rate both can be decomposed into the risk-free rate (rt) and each asset classes own risk premium. Both models share the risk free rate, but have different risk premiums.
Ultimately, co-movement between the two asset classes will generally be driven by the interaction between the variables in the numerator and denominator. For example, let’s consider how negative correlation occurs in an extreme deflationary period when the economy contracts and market volatility increases. The equity risk premium will tend to expand as investors will want to be compensated more for holding equity risk, while cashflow expectations fall. On the other hand, due to the more certain cashflows provided by bonds (assuming investment grade quality), the bond risk premium may contract if investors flock to bonds as a safe-haven assets. With quantitative easing, the risk free rate will also fall, but for equities expansion of the equity risk premium could dominate. Below visually illustrates the phenomena. The colors show the effect on price, and the arrows indicate direction of the change.

Now consider the other extreme of high inflation. When inflation is high it can create the condition for joint movement in discount rates resulting in higher stock-bond correlation. When looking at both valuation formulas shown above, the denominators will tend to increase at the same time. High inflation will lead to an increase in both bond and equity risk premia (BRP and ERP), as there are detrimental effects to real earnings growth for stocks and real yields for bonds. Furthermore, monetary policy is often tighter, leading to rising rates (rt).
One thing to note is that for stocks, in theory, a rise in prices levels should mean a rise in nominal revenues and therefore increase valuations. However, this could be offset by high input costs, and so that relationship will influence the direction of the numerator. If the net effects of changes in the denominator dominate for stocks, then there will be positive correlation between stocks and bonds in high inflationary periods.
Implications for Portfolio Construction
Currently, as inflation has reached levels not seen for decades, central banks are tightening monetary policy while bond yields are generating historically low income. Consequently, investors are now forced to rethink how they manage portfolio risk as they begin to observe this positive correlation while acknowledging that macro turning points are difficult to predict. All else equal, increasing correlation among assets in an investor’s portfolio increases portfolio risk and reduces risk-adjusted returns and the ability to diversify, especially for the sake of downside protection. Thus, in our opinion it is essential to focus on asset classes and/or strategies that are capable of robust response to changing macroeconomic conditions, while maintaining the potential for diversification. Typically, to combat inflation, investors could also consider allocations to real assets such as real estate, commodities or inflation-protected securities like TIPS.
An Active Solution
One way to manage correlation risk is to include active trend following strategies, as they are mechanically designed to be less correlated to other components of a typical portfolio, thereby providing much-needed diversification. As a simple analysis, we can look at Table 1 for correlations between assets. Consider an active trend-following index (Barclays CTA TR Index) with volatility scaled to 10%. For the periods before and after 2000, we can see that the correlation for the trend-following index generally remained near zero to US equities (-0.01 and 0.03%, respectively) while still providing a consistent return profile for the allotted volatility (8.85% and 7.23%, respectively). On the other hand, the performance of a passive commodity index (S&P GSCI TR Index) was not as consistent between the two regimes (7.03% and 0.89%, respectively). Furthermore, although Treasury volatility has remained stable, yield compression has reduced the potential returns of the asset class in the current era.
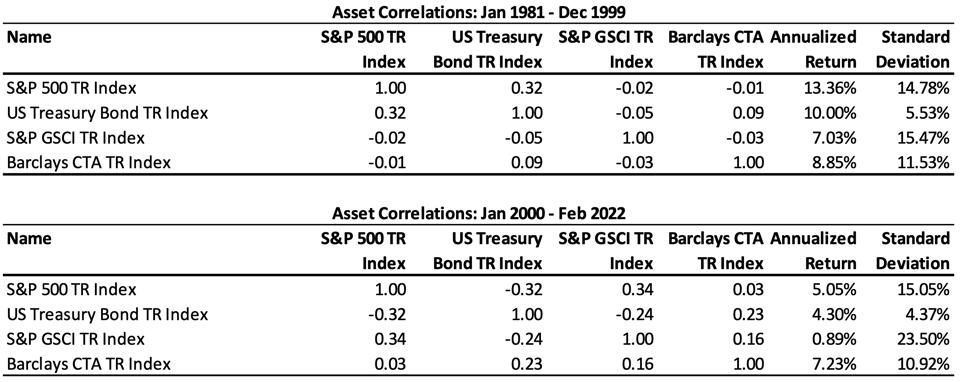
Table 1. Comparison of correlations before and after 2000. Kensington Asset Management performed calculations. Bloomberg L.P. and Norgate Data
provide indices data. Barclays CTA TR Index returns start in 1981 to allow 12 months of existing return data to calculate volatility for scaling.
The Kensington Advantage
As correlations between assets shift over time, investors must be thoughtful about the risks posed by changing environments. At Kensington Asset Management, we have specialized in active trend following investment strategies for over three decades, utilizing a systematic, model-driven framework. Through both calm and adversarial markets, regardless of the current environment, we seek to provide our investors with products that can improve portfolio robustness, offering investors peace of mind.
Kensington’s newest strategy, Active Advantage, is our solution to address the challenges presented to traditional balanced strategies. Active Advantage is a tactical balanced strategy developed by integrating Kensington’s time-tested equity and fixed income quantitative approaches to create a proprietary strategy that will typically provide exposure to both equity and fixed income markets with the flexibility to shift its overall asset allocation significantly to take advantage of prevailing market conditions.
With elevated volatility in the market and heightened stock-bond correlations, Kensington believes investors are best served with portfolio solutions that seek to identify and participate in positive trends in both equity and fixed income markets – with the flexibility to pivot risk exposures or exit markets all together when conditions deteriorate. By doing so, we strive to reduce drawdowns and downside volatility and provide low relative correlation to broad markets and “buy and hold” passive investing strategies.