

At Kensington Asset Management, our top priority is avoiding drawdowns in all types of market conditions. Since the inception of our Managed Income Strategy in 1992, we’ve seen steep declines from the bubble-bursting drawdowns of 2001 and 2008, and in 2020, due to the COVID-19 outbreak. But drawdowns of 10% or more can occur in the middle of a secular bull market as well, as we saw most recently from September-December 2018.
In striving to sidestep or mitigate drawdowns, Kensington has been able to deliver meaningful risk-adjusted returns for its clients. But how does the Managed Income Strategy historically perform after a drawdown cycle has come to an end? To find out, we studied the behavior of Kensington’s model signals coming out of the last four notable drawdowns.
About Managed Income
Before we get into the results of our study, it’s important to understand how the Managed Income Strategy works. Kensington uses a proprietary trend-following model to identify and act on prevailing market sentiment. The model provides daily signals to guide the Strategy’s allocation. Managed Income has two investment modes:
- Risk-On: When markets are generally trending upward, Managed Income allocates to higher yielding fixed income securities. This allows the Strategy to reap the highest level of yield when confidence in the market is high.
- Risk-Off: When the overall trend is one of decline or high volatility, Managed Income shifts into shorter duration instruments, including Treasuries or cash equivalents.
Historically, the declining, or “risk-off” phase of the cycle tends to be shorter in duration than the advancing phase. One reason is a function of human nature and the forceful emotional intensity of fear that builds to a crescendo quickly. Reliance on Managed Income’s model reduces the elements of emotion and subjectivity from the decision-making process. This serves to improve our ability to identify the point at which panic ends and recovery begins. Now, let’s look at how this has played out historically.
When a New Cycle Starts
To take a closer look at the behavior of the Managed Income model when a longer-term “risk-on” environment is entered, let’s review the last four notable periods of drawdown: 2001, 2008, 2016, and 2018. As shown in Figure 1, each one of these periods witnessed drawdowns in the equity markets of over 12%. Each time period starts at a market peak and ends upon the Managed Income signal going into “risk-on” mode.
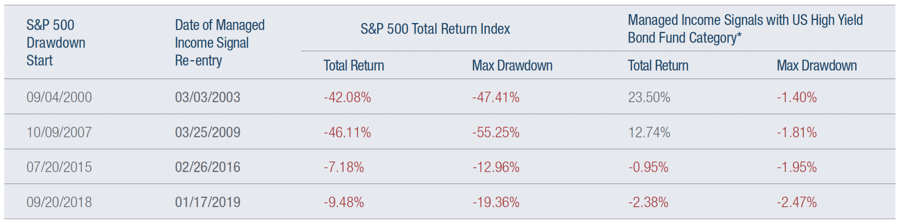
Figure 1. Characteristics of the time periods for the study. The date of re-entry represents the point at which Managed Income’s signal becomes
“risk-on,” moving the Strategy into investments primarily in the high yield sector.
*Total return and max drawdown measured by taking the total return of the US High Yield Category when the Managed Income historical signal was “risk-on,” with a 100% allocation to cash when a “risk-off” signal was present. These returns are for illustrative purposes only and are not necessarily indicative of the Managed Income Strategy’s actual performance during these periods. “Max drawdown” is defined as the maximum peak-to-trough decline, before a new peak is attained. Past performance is not an indicator of future results.
Next, we compared Managed Income’s tactical signal to the US High Yield Bond Fund category to determine the velocity of an upward movement coming out of these periods, since Managed Income utilizes high yield primarily during a “risk-on” environment. For each period, we looked at returns for the first 120 days.
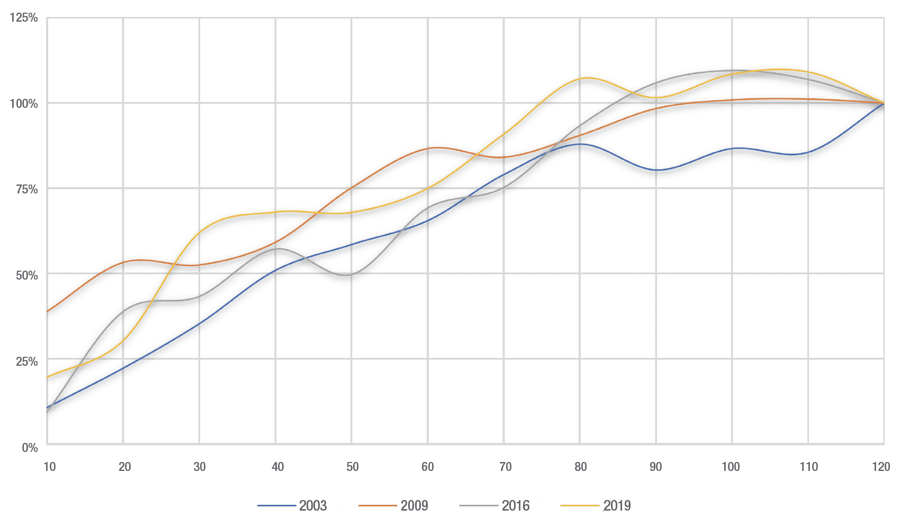
Figure 2. Percentage of first 120 days’ return observed during each time frame. Returns were calculated by applying the Managed Income model
signals to the US High Yield Bond Fund category.
As shown in Figure 2, for each of these crisis periods, between 51% and 68% of the first 120 days’ return was achieved within the first 40 days. This illustrates the potential velocity of a rebound period within the early weeks of a long-term trend reversal.
The Benefits of Active Trend-Following
In all market cycles, we believe the Kensington Managed Income Strategy can help clients by protecting against larger drawdowns, while generating meaningful risk-adjusted returns during upward-trending markets. What’s more, based on the results of the study above, we believe the ability to participate in a “rebound” trend may be considerably enhanced as well, based on the historical behavior of the Managed Income model’s signals. This underscores the case for active trend-following as part of a core allocation.
When coming out of a sideways or down trend, identifying the point of re-entry can assist in providing strong returns, especially during the first 40 days of the trend. A reliable trend-following framework can potentially provide the benefit of generating strong risk-adjusted returns by identifying safe re-entry points. We believe Kensington’s quantitative approach provides the best of both worlds, by avoiding large drawdowns, while allowing for the potential to ride the wave of strong uptrends coming out of a market pullback.
About Kensington Asset Management
Kensington Asset Management specializes in data-driven quantitative decision models that apply to the equity and fixed income markets. Founded by Bruce DeLaurentis in 1984, initially under the name Kensington Analytics, Kensington strives to minimize subjectivity in the decision-making process to generate steady, above-average positive returns with low volatility and downside protection.
For More Information
info@kensingtonassetmanagement.com | KensingtonAssetManagement.com | 877.891.1222
There is no guarantee any strategy will generate a profit or prevent a loss. There is no guarantee the Kensington Managed Income Strategy will meet its objective. Investing in the securities markets involves risk, including loss of principal. Advisors Preferred, LLC dba Kensington Asset Management is the advisor to the Kensington Managed Income Strategy. Bruce P. DeLaurentis is portfolio manager to the Strategy and an investment adviser representative of Kensington Asset Management, LLC. Past performance is not an indicator of future results.