


2023 YEAR IN REVIEW
Geopolitics: 2023 proved to be a tumultuous year with two ongoing hot wars (one effectively a proxy war between Russia and the West), a contentious and increasingly protectionist relationship between the U.S. and China, and turmoil in the Middle East that threaten critical global shipping lanes, all of which pose challenges to financial markets. Historically, geopolitics have not had a meaningful impact on the private sector (if anything, war has been a profitable enterprise) but some fear that the global unrest that has arisen following the worldwide pandemic may turn out to be different.
Looking back on history, the fall of the Berlin Wall and its associated pax Americana, the subsequent spread of capitalism across the globe (albeit in various forms), the accession of communist China into the WTO in 2001 and major contribution to global economic growth (China’s trade surged nine-fold between 2001 and 2021), the relaxation of tariffs, the globalization of supply chains and accompanying reduction in labor costs, all have contributed to an exceedingly benign market environment in the past few decades.
Now, however, those trends appear set to reverse. Part of this is inevitable with China’s emergence as an economically developed country and competing superpower with America. Both sides now are driven to secure natural resources to sustain domestic economic growth and ensure national security. At the same time, there are an increasing number of resource laden nations who seek to carve out a more independent role for themselves outside of the direct influence of both China and America. This competition among nations for strategic commodities has the potential to lead to conflict, shortages and higher prices as happened in the 1970s.
Domestically, there are demographic trends at play as well: a generational transition from Boomers to Millennials, Generation X and Z. As the latter assume increasing power and influence, they bring with them a different set of priorities. Those priorities are shaped, in part, by a deep feeling the system is unfairly stacked against them, as evidenced by the growth in inequality in how the nation’s wealth has been distributed over the past forty years. As Cem Karsan of Kai Volatility pointed out, the concentration of wealth in the U.S. can be captured statistically by the Gini coefficient1 which has gone from 0.32 to 0.46, a dramatic increase in income inequality.
All of these changes suggest future behavior of financial markets is unclear and warrant greater reliance on tactical flexibility in the management of investments in the years ahead.
Stock market: The market finished the month, quarter and year up strongly with the S&P 500 gaining 8.7%, 12.75% and 24.23%, respectively. The Nasdaq 100 was up 5.51%, 14.34% and an eye-popping 53.81% over the same periods. The small-cap Russell 2000 Index, a laggard for most of the year, rebounded 12.05% in December and gained 13.56% in the quarter and 15.09% in the year. Overseas bourses also performed handsomely in 2023, with the Euro Stoxx 50 Index up 19.19% and the MSCI EAFE Index appreciating 16.16%.
Large cap stocks were the clear winner last year among Large, Medium and Small cap, with Technology, Communication Services and Consumer Discretionary sectors strongly outperforming the other eight that combined make up the S&P 500’s 500 companies. But the real story in 2023 was the performance of the so-called “Magnificent Seven”, the group of mega-cap technology focused stocks which were up an astounding 111% on the promise of generating immense benefits from advances in artificial intelligence. Outside of those seven stocks, however, the gains were far more muted, with the other 493 only returning ~6%.
The companies making up the Magnificent Seven – Nvidia, Apple, Amazon, Microsoft, Meta Platforms, Alphabet (Google), and Tesla - accounted for 52% of the entire S&P 500’s gain in 2023, and by year’s end close to 30% of the index’s capitalization.
This type of extreme concentration in index performance and capitalization is rarely seen in markets and holds a cautionary lesson for investors about passive investing and the performance imperative of active portfolio management.
The S&P 500 Index has not been this concentrated in years, if ever. Similar concentration in the past has preceded a number of serious market declines, so investors would do well to take note.
Fixed Income: Fixed income markets continued to advance in December extending the rally that began at the close of October when a combination of fortuitous Treasury auction positioning, benign inflation data, and an overall economic slowdown convinced investors the two-year bear market in bonds was coming to an end. The two-month surge wiped out year-to-date losses across the complex with the U.S. Treasury 10-Year ending the year up 3.54%, the Bloomberg U.S. Corporate Investment Grade Index advancing 8.52%, the Bloomberg Mortgage-Backed Securities Index gaining 5.05% and the Bloomberg Corporate High Yield up a robust 13.45%.
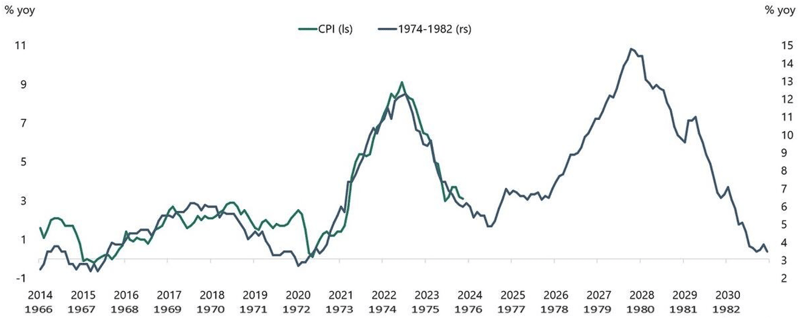
Markets continue to be heartened by the positive news on the inflation front, exemplified by the decline in the six-month annualized Personal Consumption Expenditures (PCE) Deflator and Core PCE inflation rate of change to 2%. With shelter inflation, a major component of the price indexes, expected to exert a significant downward pull in the months ahead, there appears little reason in the short run to believe the cyclical downturn in inflation will reverse anytime soon.
Nonetheless, there remains the question as to whether this is a temporary downturn in prices to be followed by an eventual transition to a secularly higher inflation environment. As pointed out above, the forces of populism, de-globalization of a demographic-induced shift to a younger and less productive work force, and the financing of the country’s huge federal deficit (likely by partially monetizing it) carry with them the possibility of an upswing in prices reminiscent of the 1970s.
Source: Apollo Global Management, as of Dec 27, 2023
From a shorter term perspective, the bond market will face a few significant challenges in 2024. One is financing the U.S. fiscal deficit while at the same time minimizing upward pressure on Treasury rates and the other is successfully refinancing the wall of corporate bond maturities set to mature this year and into 2025-2026.
The national deficit is now approaching $34 Trillion, an amount that is expected to increase even further over the next few years bringing the deficit to over 120% of GDP according to Fitch Ratings Service.
In regards to corporate refinancing needs, Michael Howell of Crossborder Capital has astutely pointed out bond and stock markets run on liquidity, which can best be defined by the ability of government and corporate entities to refinance their debts easily and at a reasonable cost. (MM/DD/YY or MM/YY) Corporate debt maturities are set to rise in the coming years, creating potential pressure to refinance at prevailing rates. In the High Yield sector, however, maturities will not ramp up significantly until 2025 and beyond, with less than 4% of issuances set to mature in 2024 (chart below).
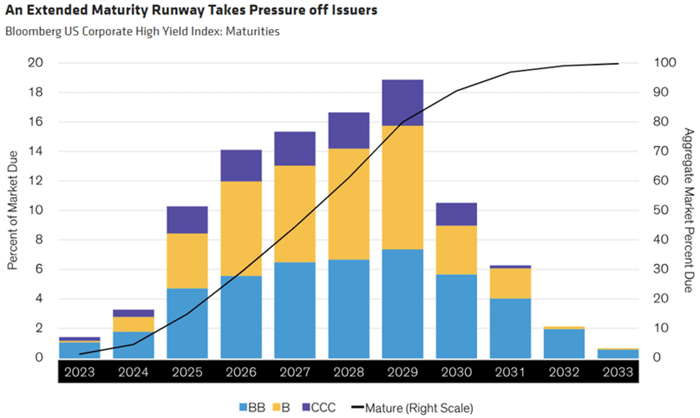
Source: AllianceBernstein, as of March 31, 2023
The Federal Reserve and Economic Policy: 2023 was a bit of a year of redemption for Jerome Powell and the Fed as it saw its series of multiple rate hikes and quantitative tightening take hold and slow – for now – price pressures in the economy. It is up for debate whether it was these actions, or the “normal” restocking of inventories and repair/recreation of supply chains that accounted for the drop in inflation but regardless, both the Fed and market welcomed the news.
Looking forward, rate markets continue to price in an outright pivot by the Fed sometime in the first half of 2024, effectively concluding the tightening program it instituted in early 2022. The Fed will need to walk a fine line as it attempts to modulate those expectations, however, as financial conditions have already eased considerably since the first half of 2023 (chart below).
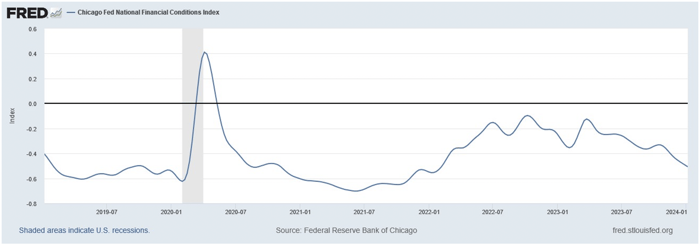
Source: Federal Reserve Bank of Chicago
Managed Income Strategy
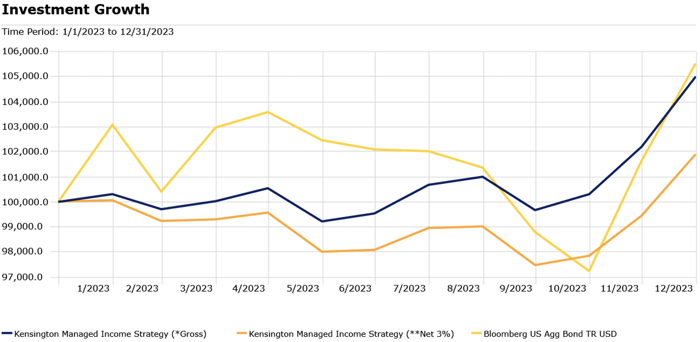
(Composite) The Growth of $100,000 chart reflects a hypothetical $100,000 investment in the strategy in 2023. Assumes reinvestment of dividends and capital gains. *Gross returns do not include the deduction of transaction costs and are shown as supplemental information. **Net performance values and statistics reflect the deduction of model fees of 3% as the highest possible fee that would be charged to an investor and may not reflect actual deducted fees. Source: Morningstar
Performance: The Managed Income Strategy finished 5.01% (gross) in 2023 compared to the 5.53% for the Bloomberg US Aggregate Bond Index.
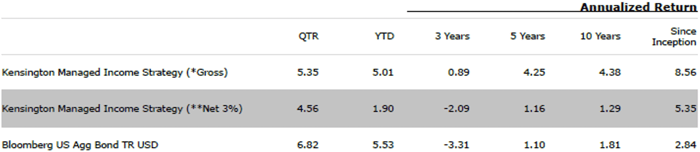
(Composite) Inception date: December 31, 2007. Returns greater than 1 year are annualized.
Performance information through December 31, 2023.
Manager Commentary: U.S. High Yield began the year with a strong January, before falling back into a rangebound pattern from February through August. During this time period, the effective yield for the ICE Bank of America U.S. High Yield Index oscillated between 8-9%. In the absence of a strongly trending market, the Managed Income Strategy experienced above average trading activity in 2023, with four periods of Risk-On and four periods of Risk-Off. This resulted in Managed Income absorbing some of the drawdowns of U.S. High Yield, while missing recovery upside—a classic example of a “whipsaw” trade. In the midst of this rangebound activity, the portfolio management team supplemented Managed Income’s high yield positions by adding senior loan/floating rate positions, which were less susceptible to pullbacks due to continued rising interest rates through the third quarter. In the fourth quarter, U.S. High Yield finally broke its rangebound pattern, first declining before posting strong returns in November and December. Managed Income was able to take advantage of this momentum, entering a Risk-On stance in early November and remaining fully invested through year end.
Dynamic Growth Strategy
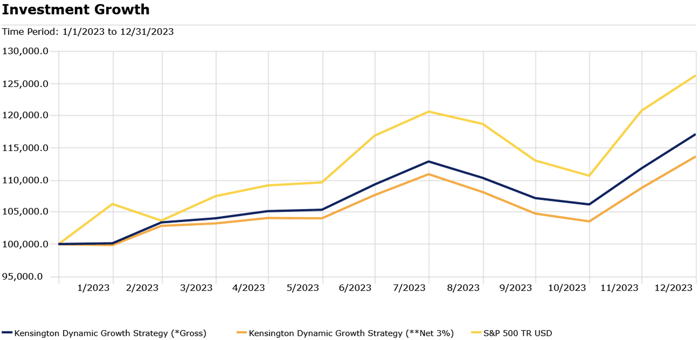
(Composite) The Growth of $100,000 chart reflects a hypothetical $100,000 investment in the strategy in 2023. Assumes reinvestment of dividends and capital gains. *Gross returns do not include the deduction of transaction costs and are shown as supplemental information. **Net performance values and statistics reflect the deduction of model fees of 3% as the highest possible fee that would be charged to an investor and may not reflect actual deducted fees. Source: Morningstar
Performance: The Dynamic Growth Strategy finished 17.14% (gross) in 2023 compared to 26.29% for the S&P 500.
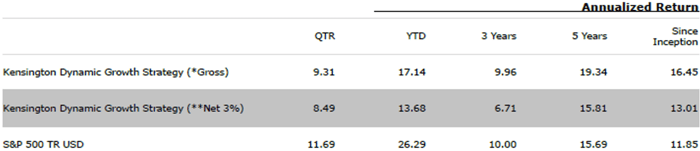
(Composite) Inception date: December 31, 2014. Returns greater than 1 year are annualized. Performance information through December 31, 2023.
Manager Commentary: The US Equity markets roared back in 2023, rebounding from the worst year for the S&P 500 and NASDAQ since 2008. Coming off a rough end to the year, Dynamic Growth remained in a Risk-Off stance to begin the year, falling behind as equity markets printed a strong January. Dynamic Growth alternated between Risk-On and Risk-Off postures for the remainder of the first quarter, seeking to take advantage of this positive momentum while managing risk. After the mini bank crisis that unfolded in March, the strategy reverted back to Risk-On mode for much of the spring, before taking another Risk-Off pause in May. This move was driven largely by poor equity breadth, combined with overheated signals in the marketplace.
What came next was the rise of the so-called “Magnificent Seven,” a group of mega-cap stocks that drove market sentiment for the remainder of the year. Eventually, Dynamic Growth rejoined the momentum trade in progress, remaining largely Risk-On before staying away during most of August, September, and October. This period of the year typically exhibits poor seasonal behavior, and 2023 was no different. By staying defensive, Dynamic Growth was able to shield against a meaningful amount of negative return for the equity indices for these months.
After the Federal Reserve meeting in early November, market participants became increasingly bullish, driven by a perceived pause in interest rates in the short term. The result was a strong finish to the year for equities. Dynamic Growth re-entered a full Risk-On position in early November, riding this trend through year-end. Ultimately, while Dynamic Growth lagged the broader markets in 2023, due largely to short bursts of momentum in January and May, the importance of full-cycle investing was underscored as the Strategy broadly outperformed the major equity indices through managing risk and drawdowns for most of 2022.
.
Active Advantage Strategy
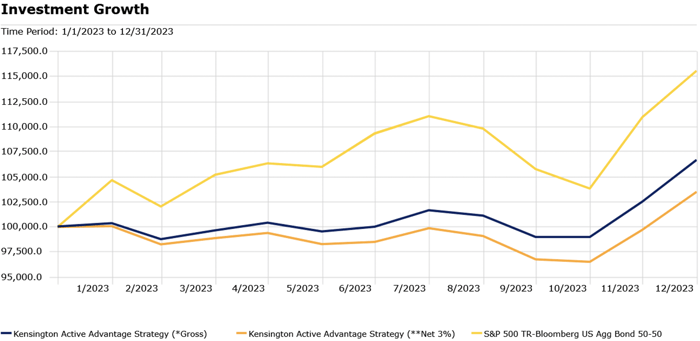
(Composite) The Growth of $100,000 chart reflects a hypothetical $100,000 investment in the strategy in 2023. Assumes reinvestment of dividends and capital gains. *Gross returns do not include the deduction of transaction costs and are shown as supplemental information. **Net performance values and statistics reflect the deduction of model fees of 3% as the highest possible fee that would be charged to an investor and may not reflect actual deducted fees. Inception date: December 31, 2021. Source: Morningstar
Performance: The Active Advantage Strategy finished up 6.66% (gross) in 2023 compared to 15.58% for its benchmark (a 50/50 split between the S&P 500 and the Bloomberg US Aggregate Bond Index).
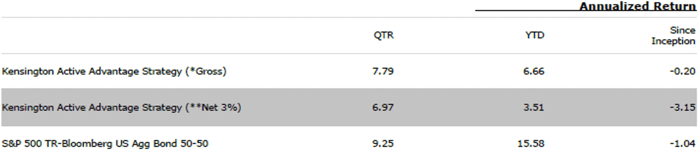
(Composite) Inception date: December 31, 2021. Performance information through December 31, 2023.
Manager Commentary: As with the other strategies, Active Advantage remained Risk-Off to begin the year, missing out on a short burst of positive momentum across all sectors. The Strategy remained largely Risk-Off, holding a variety of blended positions with cash equivalents, for much of the first quarter, before entering a fully Risk-On position in early April. In late May, Active Advantage shifted into a fully Risk-Off position, as yields pushed higher and core equities chopped along. As with the other Strategies, Active Advantage spent most of late summer on the sidelines, before re-entering a full Risk-On stance in early November and remaining fully invested through year-end. From a performance perspective, Active Advantage finished in between the two components of its benchmark—the S&P 500 and the Bloomberg US Aggregate Bond Index—yet came in under the benchmark, an average of the two. This was driven primarily by Active Advantage remaining Risk-Off in its fixed income weighting for a considerable portion of the year, while also being underweighted equities during certain periods of the year, such as January and May, when equities notched strong performance.
Defender Strategy
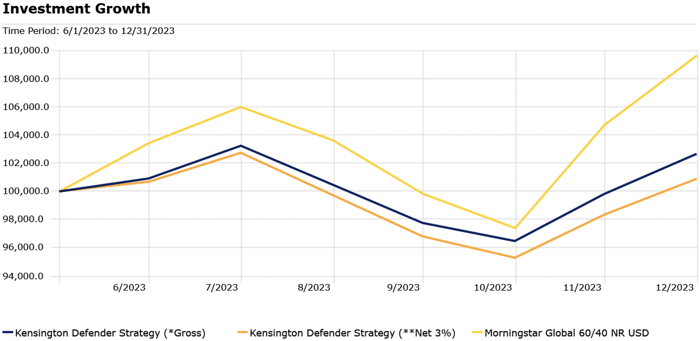
(Composite) The Growth of $100,000 chart reflects a hypothetical $100,000 investment in the strategy in 2023. Assumes reinvestment of dividends and capital gains. *Gross returns do not include the deduction of transaction costs and are shown as supplemental information. **Net performance values and statistics reflect the deduction of model fees of 3% as the highest possible fee that would be charged to an investor and may not reflect actual deducted fees. Inception date: May 31, 2023. Source: Morningstar
Performance: The Defender Strategy finished up 6.49% (gross) in 2023 compared to 14.81% for its benchmark the Morningstar Global 60/40 Index.
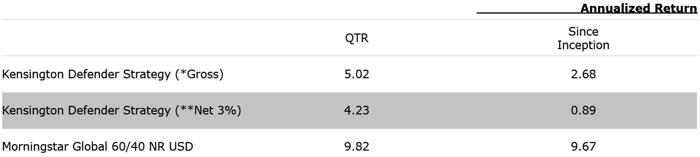
(Composite) Inception date: May 31, 2023. Performance information through December 31, 2023.
Manager Commentary: Markets are really good at proving the majority wrong, and 2023 was no different. Beginning the year, bearish consensus views on the market were entrenched in the minds of investors and a multitude of economic outlooks. However, the S&P 500 finishes December and the year with returns of 4.4% and 24.23%, respectively. The overly bearish sentiment and oversold market conditions left the market ripe for a year-end rally, which investors saw across almost all asset classes. From the lows at the end of October, large caps were up 16%, but small caps were up an impressive 24%, reflecting a broadening of the market rally to end the year. The breadth and momentum of this rally is evident from the fact that the percentage of stocks above their 50-day moving averages rose above 85% by the end of December, signifying improved and broad participation across the multiple indices compared to earlier in the year. The Defender Strategy was able to capture this momentum at the year’s end across the six asset classes for that time period. In addition, even with drastically decreased volatility, the options overlay portion of the portfolio also captured positive gains by making small gains each week as a positive attribute to overall performance. Some of the biggest detractors for 2023 were international exposure and mostly sideways markets for a good portion of year. Slow and steady strategies that avoid large downs don’t always feel good during rapid and strong performing headline markets, but held with discipline through entire market cycles often prove to be prudent for most investors.
Looking Ahead to 2024
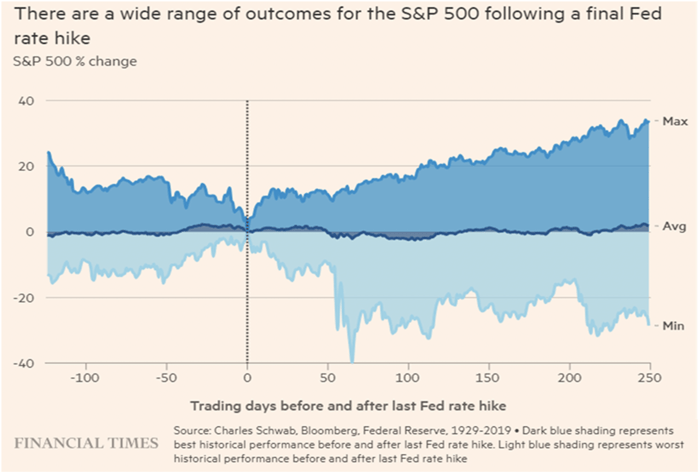
As we turn the page to 2024, there are still many unanswered questions with respect to the macro market picture. Certainly, the largest focus for many investors will be centered around the current rate hiking cycle. As of the beginning of 2024, market participants are pricing in several rate cuts—a departure from the previous 24 months. However, there still seems to be a disconnect with the Fed, who has signaled that “higher for longer” remains a theme moving into the new year. As shown below, if the final hike is indeed in for this cycle, the majority of prior instances show a clear upside bias. The S&P 500 gained 16.8% on average in the 12 months following the prior six conclusions to Fed tightening cycles, with only one negative outcome (1999-2000).
For fixed income, if rates do begin to fall, forward-looking returns across the board appear promising as bonds have been up 12 months post hiking cycle in each of the previous six instances. This would tend to favor U.S. High Yield in Risk-On regimes. In addition, for the first time since 2021, the setup for the strategies to employ U.S. Treasuries during Risk-Off regimes could be a possibility. On the equity side, the “higher for longer” narrative, coupled with continued positive economic data, is likely to result in longer stretches of Risk-On activity. However, with a recession not fully off the table for 2024, any missteps in the broader economy could also mean a correction, which increases the likelihood for the strategies to be Risk-Off.
2024 Playbook
As investors, it’s important to be prepared for whatever environment presents itself. With that in mind, below is a table of potential scenarios for 2024 and how we would expect to position our portfolios in such an environment:
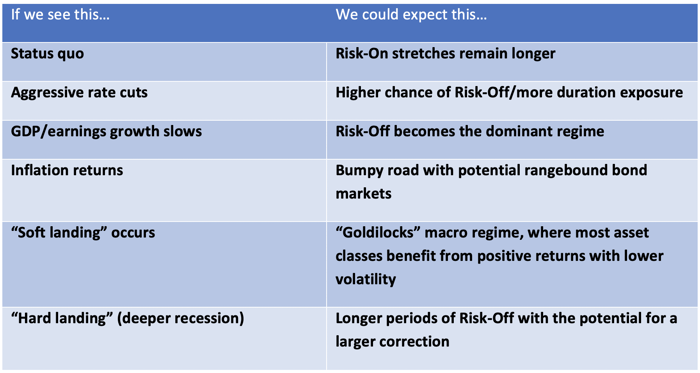
Regardless of which scenario (or scenarios) present themselves, we believe a tactical approach will prove valuable in navigating what are sure to be interesting markets in the months and years to come. We remain committed to executing on our primary mandate of generating steady above-average positive returns with low volatility and downside protection.
1The Gini coefficient measures the inequality among the values of a frequency distribution, such as levels of income. A Gini coefficient of 0 reflects perfect equality, where all income or wealth values are the same, while a Gini coefficient of 1 (or 100%) reflects maximal inequality.
Click below to subscribe to our Insights!
Receive email notifications when new articles are published

Disclaimer:
Investing involves risk, including loss of principal. Past performance does not guarantee future results. There is no guarantee any investment strategy will generate a profit or prevent a loss.
This is for informational purposes only and is not a recommendation nor solicitation to buy, sell or invest in any investment product or strategy. Our materials may contain information deemed to be correct and appropriate at a given time but may not reflect our current views or opinions due to changing market conditions. No information provided should be viewed as or used as a substitute for individualized investment advice. An investor should consider the investment objectives, risks, charges, and expenses of the investment and the strategy carefully before investing.
Kensington Asset Management, LLC (“KAM”) relies on third party sources for some of its information that we believe is reliable. However, we make no representation, warranty, endorse or affirm as to its accuracy or completeness. The information provided is current as of the date of publication and may be subject to change. We are not responsible for updating this information to reflect any subsequent developments or events.
Any indices and other financial benchmarks shown are provided for illustrative purposes only, are unmanaged, reflect reinvestment of income and dividends and do not reflect the impact of advisory fees. Investors cannot invest directly in an index. Comparisons to indexes have limitations because indexes have volatility and other material characteristics that may differ from a particular strategy such as the types of securities being substantially different.
Certain information contained herein constitutes “forward-looking statements,” which can be identified using forward-looking terminology such as “may,” “will,” “should,” “expect,” “anticipate,” “project,” “estimate,” “intend,” “continue,” or “believe,” or the negatives thereof or other variations thereon or comparable terminology. Due to various risks and uncertainties, actual events, results, or actual performance may differ materially from those reflected or contemplated in such forward-looking statements. Nothing contained herein may be relied upon as a guarantee, promise, assurance, or a representation as to the future.
Kensington Asset Management does not charge an advisory fee. *Gross returns do not include the deduction of transaction costs and are shown as supplemental information. **Net performance values and statistics reflect the deduction of model fees of 3% as the highest possible fee that would be charged to an investor and may not reflect actual deducted fees.
Performance represents past performance, which is not an indicator of future results and the value of investments and the income derived from them can go down as well as up. Future returns are not guaranteed and a loss of principal may occur. There is no guarantee any investment strategy will generate a profit or prevent a loss. An investment in securities involves risk, including loss of principal. No investment strategy is guaranteed to generate a profit or prevent losses.
Managed Income Strategy
Kensington Asset Management claims compliance with the Global Investment Performance Standards (GIPS®). Kensington Asset Management has been independently verified for the period of January 1, 2008 through December 31, 2022. The lead manager primarily responsible for achieving prior performance began managing this strategy on 12/31/2007 and has continued this strategy at several firms in the same capacity prior to Kensington Asset Management, LLC. Additionally, the accounts managed and the investment process employed for this strategy at the prior firms remain substantially similar. Therefore, Kensington Asset Management, LLC uses 12/31/07 as the inception date for the Managed Income Strategy. Kensington Managed Income was formerly referred to as High Yield Bond Strategy. The name of the organization was formerly known as Kensington Asset Management until 09/24/2012 and then as Kensington Analytics until 8/14/2020 before re-assuming the Kensington Asset Management name.
The Composite was created and incepted in January 2008 and only includes accounts with a minimum of $100K. GIPS® is a registered trademark of CFA Institute. CFA Institute does not endorse or promote this organization, nor does it warrant the accuracy or quality of the content contained herein. Results are based on fully discretionary accounts under management, including those accounts no longer with the Firm. The U.S. Dollar is the currency used to express performance. An investment in securities involves risk, including loss of principal. Returns are presented net of fees and include the reinvestment of all income. Performance represents past performance.
Risks specific to the Managed Income Strategy include Management Risk, High-Yield Risk, Fixed-Income Security Risk, Foreign Investment Risk, Loans Risk, Market Risk, Underlying Funds Risk, Non-Diversification Risk, Turnover Risk, U.S. Government Securities Risk, LIBOR Risk, Models and Data Risk.
The types of securities held by a comparison benchmark may be substantially different from the investment strategy. An investor should consider the investment objectives, risks, charges, and expenses of the investment and the strategy carefully before investing. The Managed Income Strategy uses the Bloomberg Barclays US Aggregate Bond Index as its benchmark, as this index is, in Kensington’s view, a representative index for the broader fixed income market. The Bloomberg U.S. Aggregate Bond Index is a market capitalization-weighted intermediate term index which tracks the performance of investment grade rated debt publicly traded in the United States. The types of securities held by a comparison benchmark may be substantially different from the investment strategy. It is not possible to invest in an index, and index returns do not include management fees.
Dynamic Growth Strategy
Kensington Asset Management claims compliance with the Global Investment Performance Standards (GIPS®). Kensington Asset Management has been independently verified for the period of January 1, 2015 through December 31, 2022. The lead manager primarily responsible for achieving prior performance began managing this strategy on 12/31/2014 and has continued this strategy at several firms in the same capacity prior to being managed at Kensington Asset Management, LLC effective 10/23/20. The accounts managed and the investment process employed for this strategy at the prior firms remain substantially similar. Therefore, Kensington Asset Management, LLC uses 12/31/14 as the inception date for the Dynamic Growth Strategy. Kensington Dynamic Growth was formerly referred to as Nasdaq Unconstrained Growth Tactical Allocation Model from inception through June 2020, and the Enhanced Equity Strategy from June 2020 to July 2020.
The Composite was created and incepted in January 2015 and only includes accounts with a minimum of $100k. GIPS® is a registered trademark of CFA Institute. CFA Institute does not endorse or promote this organization, nor does it warrant the accuracy or quality of the content contained herein. Results are based on fully discretionary accounts under management, including those accounts no longer with the firm. The U.S. Dollar is the currency used to express performance. An investment in securities involves risk, including loss of principal. Returns are presented net of fees and include the reinvestment of all income, Performance represents past performance.
Risks specific to the Dynamic Growth Strategy include Management Risk, Equity Securities Risk, Market Risk, Underlying Funds Risk, Non- Diversification Risk, Small and Mid-Capitalization Companies Risk, Turnover Risk, U.S. Government Securities Risk, Models and Data Risk.
The types of securities held by a comparison benchmark may be substantially different from the investment strategy. An investor should consider the investment objectives, risks, charges, and expenses of the investment and the strategy carefully before investing. The Dynamic Growth Strategy uses the S&P 500 TR Index as its benchmark, as this index is, in Kensington’s view, a representative index for the broader equity market. The S&P 500 TR Index is a capitalization weighted index of 500 stocks representing all major domestic industry groups. The S&P 500 TR Index assumes the reinvestment of dividends and capital gains. The types of securities held by a comparison benchmark may be substantially different from the investment strategy. It is not possible to invest in an index, and index returns do not include management fees.
Active Advantage Strategy
Kensington Asset Management claims compliance with the Global Investment Performance Standards (GIPS®). Kensington Asset Management has been independently verified for the period of January 1, 2022 through December 31, 2022. Inception calculation based on the inception date: 1/1/2022.
The Composite was created and incepted in January 2022 and only includes accounts with a minimum of $100K. GIPS® is a registered trademark of CFA Institute. CFA Institute does not endorse or promote this organization, nor does it warrant the accuracy or quality of the content contained herein. Results are based on fully discretionary accounts under management, including those accounts no longer with the Firm. The U.S. Dollar is the currency used to express performance. An investment in securities involves risk, including loss of principal. Returns are presented net of fees and include the reinvestment of all income. Performance represents past performance.
Risks specific to the Active Advantage Strategy include Management Risk, Equity Securities Risk, High-Yield Risk, Fixed-Income Security Risk, Foreign Investment Risk, Loans Risk, Market Risk, Underlying Funds Risk, Limited History of Operations Risk, Non-Diversification Risk, Small and Mid-Capitalization Companies Risk, Turnover Risk, U.S. Government Securities Risk, LIBOR Risk, Models and Data Risk.
The types of securities held by a comparison benchmark may be substantially different from the investment strategy. An investor should consider the investment objectives, risks, charges, and expenses of the investment and the strategy carefully before investing. The Active Advantage Strategy uses a 50/50 blend of the S&P 500 TR Index and the Bloomberg US Aggregate Bond Index. In Kensington’s view, these indices serve as representative indices for the broader fixed income and equity markets. Weightings were chosen to represent the Strategy’s balanced nature when fully invested. The Bloomberg U.S. Aggregate Bond Index is a market capitalization-weighted intermediate term index which tracks the performance of investment grade rated debt publicly traded in the United States. The S&P 500 TR Index is a capitalization weighted index of 500 stocks representing all major domestic industry groups. The S&P 500 TR Index assumes the reinvestment of dividends and capital gains. The types of securities held by a comparison benchmark may be substantially different from the investment strategy. It is not possible to invest in an index, and index returns do not include management fees.
Defender StrategyKensington Asset Management claims compliance with the Global Investment Performance Standards (GIPS®). Kensington Asset Management has been independently verified for the period of January 1, 2022 through December 31, 2022. Inception calculation based on the inception date: 6/1/2023.
The Composite was created and incepted in June 2023 and only includes accounts with a minimum of $100K. GIPS® is a registered trademark of CFA Institute. CFA Institute does not endorse or promote this organization, nor does it warrant the accuracy or quality of the content contained herein. Results are based on fully discretionary accounts under management, including those accounts no longer with the Firm. The U.S. Dollar is the currency used to express performance. An investment in securities involves risk, including loss of principal. Returns are presented net of fees and include the reinvestment of all income. Performance represents past performance.
Risks specific to the Defender Strategy are detailed in the prospectus and include general market risk, credit risk, interest rate risk, management risk, equity securities risk, fixed-income securities risk, high-yield bond risk, foreign investment risk, emerging markets risk, real estate and REITs risk, commodities risk, currency risk, subsidiary risk, market risk, underlying funds risk, derivatives risk, limited history of operations risk, turnover risk, models and data risk, momentum risk or risk of the portfolio not performing as expected.
The types of securities held by a comparison benchmark may be substantially different from the investment strategy. An investor should consider the investment objectives, risks, charges, and expenses of the investment and the strategy carefully before investing. The Defender Strategy uses a 60/40 blend of the Morningstar Global Markets Net Return USD (60%) and Morningstar Global Core Bond Gross Return USD (40%), rebalanced to target weights of 60% equity and 40% fixed income on a monthly basis (Morningstar Global 60/40 Index). In Kensington’s view, this is a representative index for the broader global fixed income and equity markets. Weightings were chosen to represent the Strategy’s balanced nature when fully invested. The Morningstar Global Markets Index is a comprehensive benchmark that represents the performance of the global equity market covering approximately 97% of the investable market capitalization across 49 countries. The Morningstar Global Core Bond index is a comprehensive benchmark that reflects the performance of the global core bond market covering a broad range of liquid bonds from various regions and sectors. The types of securities held by a comparison benchmark may be substantially different from the investment strategy. It is not possible to invest in an index, and index returns do not include management fees.
The Kensington Defender Strategy is managed by Kensington Asset Management, LLC and sub-advised by Liquid Strategies, LLC. Additional information about the Strategy and the adviser can be obtained by viewing company disclosure documents available upon request.
Investment returns will be reduced by advisory fees and other expenses charged in the management of a client’s account. You should understand how ongoing advisory fees, compounded over several years, reduce the value of your investment portfolio, as investment balances and potential gains on the investment balances are reduced by fees. Additional information is provided in the SEC Investors Bulletin “How Fees and Expenses Affect Your Investment Portfolio.”
Advisory services offered through Kensington Asset Management, LLC, Barton Oaks Plaza, Bldg II, 901 S Mopac Expy – Ste 225, Austin, TX 78746.