

Market Insights is a piece in which Kensington’s Portfolio Management team will share interesting and thought-provoking charts that we believe provide insight into markets and the current investment landscape.
A Post Rate Cycle World
As we enter 4th quarter 2023 earnings season, the current forecast for S&P 500 earnings growth stands at +1.6% which, if accurate, would mark the second quarter in a row of positive earnings growth for the index, after a surprising +6.3% y/y earnings growth rate for the 3rd quarter. Further, according to FactSet, analysts are projecting S&P 500 y/y earnings growth of 11.8% for the calendar year 2024 (chart below).
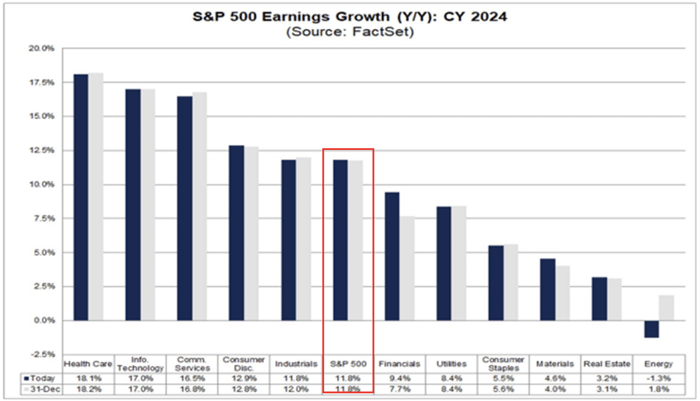
Source: FactSet as of Jan 12, 2024
This would certainly reinforce the case for a “soft landing” for the US economy and the avoidance of recession. However, while more than three-fourths of economists believe the chances of a recession in the next 12 months is now 50% or less, the New York Federal Reserve Recession Model still indicates a 62.9% chance of recession by December 2024 (chart below).
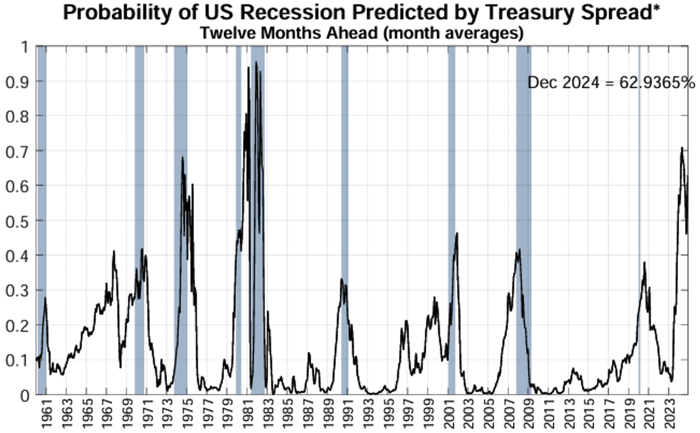
Source: NY Federal Reserve (https://www.newyorkfed.org/) as of Jan 4, 2024
We’ve previously outlined the historical evidence that leads some to believe recession is imminent, including the often cited yield curve inversion/un-inversion indicator, which the New York Fed model is predicated on. There is also the historical precedent of recession following the conclusion of each previous Federal Reserve Rate Cycle (chart below).
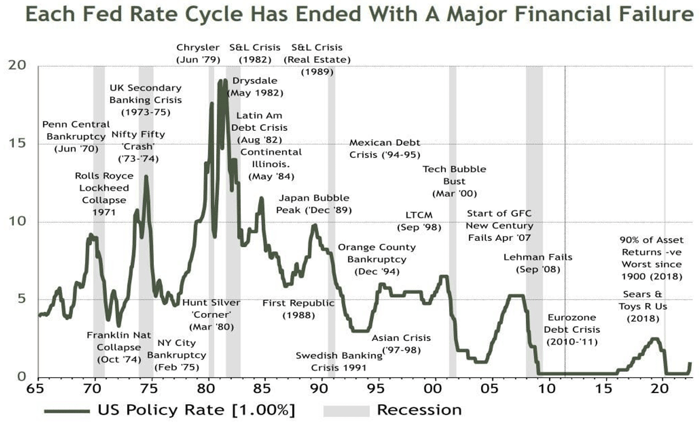
Source: ASR Ltd, Refinitiv, as of Jan 23, 2023
Recession or not, the end of a Fed Rate Cycle, which is defined as the time between troughs in the federal funds effective rate, does not necessarily spell doom for investment markets. With the Fed likely to cut rates in 2024 anywhere from 75bps to 160bps, depending on who you believe (chart below), it’s important to remember a line we often use in our Insights pieces…"The market is not the economy."
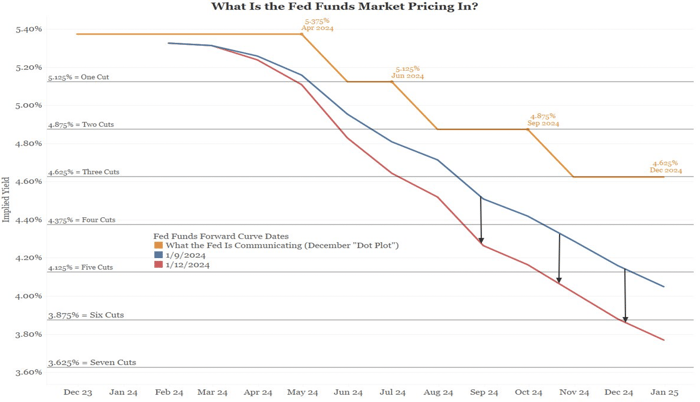
Source: Bianco Research as of Jan 12, 2024
It would reason that if Fed Rate Cycles always led to recession, and recession means negative economic growth, then markets, or at least the stock market, would suffer when Rate Cycles end. But that simply isn’t the case. In fact, historically both stock and bond markets have performed exceedingly well following Fed pivots (chart below).
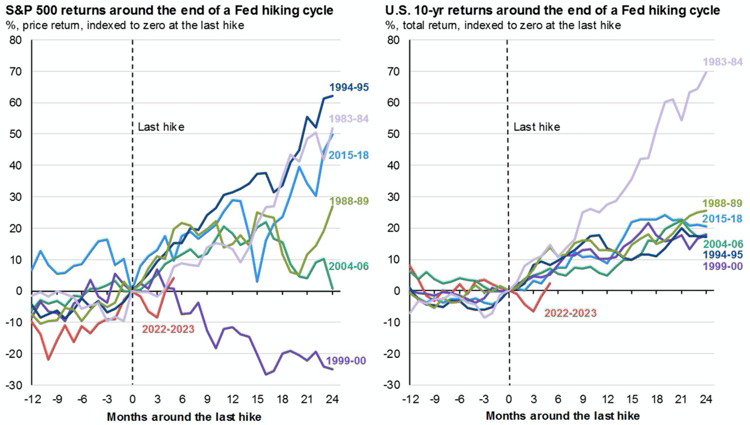
Source: JP Morgan, as of Dec 31, 2023
It makes logical sense that bond markets would rally post hiking cycles as prices for bonds rise as yields compress. Perhaps more surprising is that stocks have benefitted most from a rate hiking pause. According to Forbes, the S&P 500 gained 16.8% on average in the 12 months following the prior six conclusions to Fed tightening cycles - far outperforming the index’s historic 12% annual return. Even more compelling, the S&P gained 46.2% three years after the conclusion of its prior six hiking cycles, also outperforming historical returns.
That is not to say there are not risks for equity (or fixed income) investors going forward. The 1999-2000 cycle is evidence of that, in which the 12-month return post cycle was -12.4%, and the 3-year return post cycle was -35.6%. Markets can change quickly, and while history can provide important historical context, it can never provide a perfect road map for the future. As always, a tactical approach to investing may prove prudent for navigating equity and fixed income markets as we enter further into a post rate cycle world.
Click below to subscribe to our Insights!
Receive email notifications when new articles are published

Forward-looking statements are based on management’s then current views and assumptions and, as a result, are subject to certain risks and uncertainties that could cause actual results to differ materially from those projected. This market insight is for informational purposes only and should not be construed as a solicitation to buy or sell, or to invest in any investment product or strategy. Investing involves risk including loss of principal.
Investing involves risk. Principal loss is possible.
Past performance is not a guarantee or indicator of future results.
This is for informational purposes only and should not be construed as a recommendation nor solicitation to buy or sell, or to invest in any investment product or strategy. Materials such as blog posts, newsletters or commentary may contain information deemed to be correct and appropriate at a given time but may not reflect our current views or opinions due to changing market conditions. No information provided should be viewed as or used as a substitute for individualized investment advice.
Certain information contained herein has been obtained from third party sources and such information has not been independently verified by Kensington Asset Management, LLC (“KAM”). No representation, warranty, or undertaking, expressed or implied, is given to the accuracy or completeness of such information by KAM or any other person. While such sources are believed to be reliable, KAM does not assume any responsibility for the accuracy or completeness of such information. KAM does not undertake any obligation to update the information contained herein as of any future date.
Any indices and other financial benchmarks shown are provided for illustrative purposes only, are unmanaged, reflect reinvestment of income and dividends and do not reflect the impact of advisory fees. Investors cannot invest directly in an index. Comparisons to indexes have limitations because indexes have volatility and other material characteristics that may differ from a particular strategy. For example, a strategy may typically hold substantially fewer securities than are contained in an index.
Certain information contained herein constitutes “forward-looking statements,” which can be identified by the use of forward-looking terminology such as “may,” “will,” “should,” “expect,” “anticipate,” “project,” “estimate,” “intend,” “continue,” or “believe,” or the negatives thereof or other variations thereon or comparable terminology. Due to various risks and uncertainties, actual events, results or actual performance may differ materially from those reflected or contemplated in such forward-looking statements. Nothing contained herein may be relied upon as a guarantee, promise, assurance or a representation as to the future.
Definitions
S&P 500: A capitalization weighted index of 500 stocks representing all major domestic industry groups. The S&P 500 TR Index assumes the reinvestment of dividends and capital gains.
Yield curve inversion: A situation where the interest rates on long-term bonds are lower than the interest rates on short-term bonds. This can often be an indication of potential lower returns and lower economic growth in the future.
Yield curve un-inversion: Opposite of a yield curve inversion, where the interest rates on long-term bonds are higher than the interest rates on short-term bonds. This can often be an indication of potential higher returns and higher economic growth in the future.