

Market Insights is a piece in which Kensington’s Portfolio Management team will share interesting and thought-provoking charts that we believe provide insight into markets and the current investment landscape.
Checking in on Markets - Fixed Income
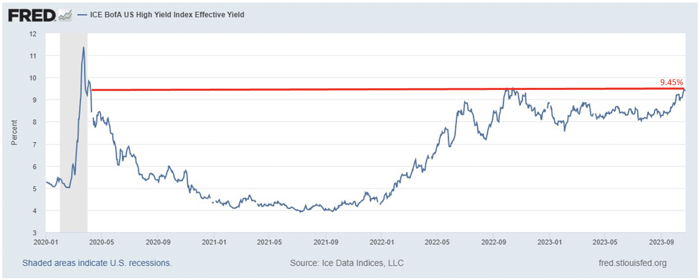
In our most recent edition of Market Insights, we noted that the current drawdown in long-duration US Treasuries is worse than the drawdown stocks experienced during the 2008 financial crisis. Since the time of that writing, yields have continued to rise, with the 10-year Treasury briefly eclipsing 5.0% this past Monday for the first time since 2007. While the recent rise in yields has centered on the longer end of the Treasury curve, it has not been contained to Treasuries alone. Higher-yielding bonds have also felt the pain as the ICE BofA US High Yield Index reached 9.45% on October 20th (chart below), the highest level since September 2022 and April 2020 prior to that.
Yet earlier this week, we saw a wild swing down in rates with the 10-year sinking 20 bps on Monday alone, dropping back to 4.8%. This move came on the heels of hedge fund manager Bill Ackman announcing he had covered his short bond position taken on August 3rd, noting there was "too much risk in the world to remain short bonds at current long-term rates."
Many have touted 2024 as the "Year of the Bond," with optimism that we'll break out of an almost three-year losing streak for the asset class. Bank of America Corp.’s Michael Hartnett noted earlier this month that he expects bonds to be the “best performing asset class in the first half of 2024” as he believes high interest rates and tighter financial conditions increase the risk of the economy making a hard landing, and will “trigger a big rally in assets that have already discounted recession (fixed income).”
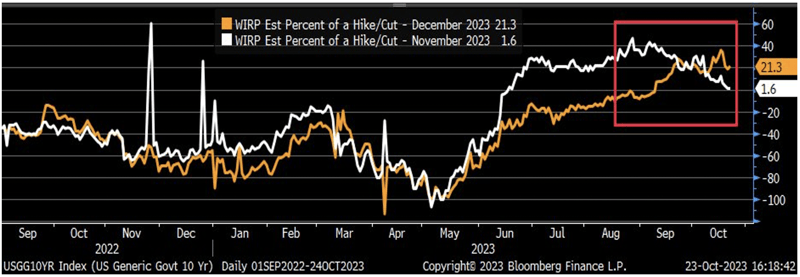
While it's too soon to know if this week's early rally will hold, it will be interesting to see how sentiment shifts after next week's FOMC meeting on November 1st. Expectations in recent weeks for a November rate hike (chart below, white) have plunged while expectations for a December hike have climbed (chart below, orange).
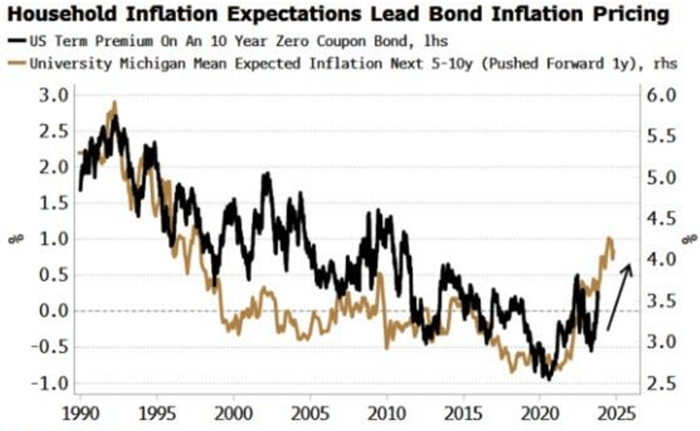
One factor that will continue to weigh heavily on a potential long-term reversal in rates will be inflation. As noted in the chart below, household inflation expectations continue to rise and have historically led bond inflation pricing. With that in mind, it may be premature to call a bottom for bonds just yet. Note that Bill Ackman said he "covered his short," not that he was long bonds.
Source: Bloomberg
Checking in on Markets – Equities
We are three weeks into Q3 earnings season, with approximately 20% of S&P 500 companies having reported. Consensus expectations are for -0.4% earnings growth, which, if it holds true, would mark the 4th quarter in a row of negative earnings growth. This week includes a slew of big tech companies reporting, including Alphabet, Amazon, Meta, and Microsoft.
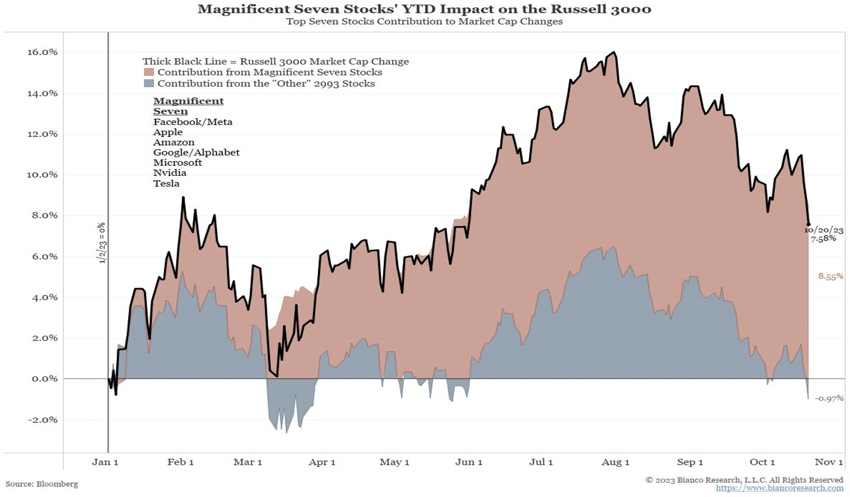
As has been the case throughout 2023, the "stock market" has been a tale of two stories. The so-called "Magnificent 7" (Meta, Apple, Amazon, Alphabet, Microsoft, Nvidia, Tesla) have broadly carried the market year-to-date. It is often cited that if you were to remove these 7 from the S&P 500, the "S&P 493" is down year-to-date, but the concentration on these seven stocks is much deeper than that. If you add up all Large, Mid, and Small Cap stocks which comprise the Russell 3000, and then remove the Magnificent 7, the remaining 2,993 stocks are down on the year (chart below). The impact of these seven companies on "market returns" cannot be overstated.
Source: Bloomberg
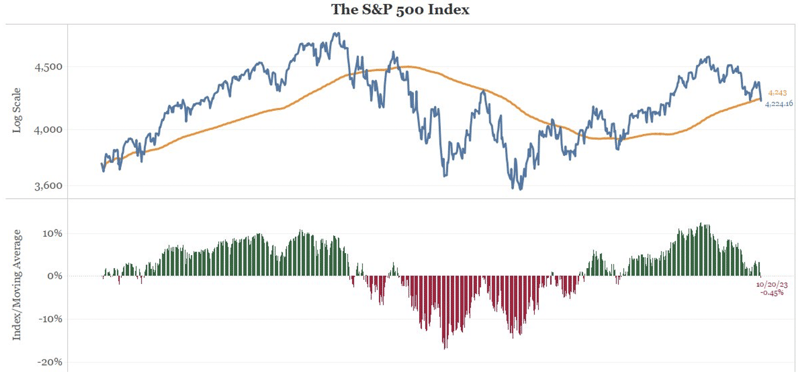
This creates a very fragile environment as we await the results of these companies' Q3 earnings. The seven combined companies currently trade at a P/E ratio of 46x (up from 29x at the start of 2023), more than double the S&P 493. Meanwhile, last week, the S&P 500 closed below its 200-day moving average for the first time in 154 days (chart below). Further, this week we have seen 2 large-cap stocks hit their 52-week high, while 55 large-cap stocks have hit their 52-week low.
While the outperformance this year of the largest capitalization stocks has been a saving grace for index investors, it has created fragility in equity markets that is difficult to observe on the surface. We'll see in the coming weeks if the rising tide of these 7 stocks can continue to lift the broad averages. Eventually, we will need to see wider upside participation, as P/E ratios for Mega Cap Tech companies can only extend so far.
Forward-looking statements are based on management’s then current views and assumptions and, as a result, are subject to certain risks and uncertainties that could cause actual results to differ materially from those projected. This market insight is for informational purposes only and should not be construed as a solicitation to buy or sell, or to invest in any investment product or strategy. Investing involves risk including loss of principal.
Click below to subscribe to our Insights!
Receive email notifications when new articles are published
